Generated by Microsoft Designer
Background
In the previous Loki article, we discussed using canary deployments with Vector to replicate real-world logs to a new Loki version. During this process, we tuned the Loki configuration for optimal performance. Once satisfied with the results, we rolled it out to the team.
Our Loki deployment uses a distributed mode, involving multiple components with distinct functions. This makes the Loki architecture complex. Before adjusting specific configurations, it's crucial to understand the relationships between these components to make informed decisions.
When tuning Loki, start with the write-related components, such as the ingester and distributor, and even the log collector mentioned in the previous article. The goal is to maximize "Full" Flush Reasons for written chunks, minimizing chunk fragmentation. This not only improves storage efficiency but also indirectly enhances query speed.
Full chunks mean fewer chunks are needed to represent the same volume of logs. This reduces the number of indexes Loki needs to create. When querying, Loki searches the index based on the query content. Fewer chunks associated with an index result in faster chunk retrieval, allowing the querier to focus on execution and reducing overall query time.
Therefore, we invested significant time in optimizing Loki's write performance, which in turn improved read performance. The following sections detail the configuration adjustments we made for both write and read operations.
Loki Write Config Tuning
Ingester
ingester.chunk-encoding: Set this directly to snappy. While not the highest compression ratio compared to gzip, it offers a good balance of speed and compression. The official configuration and official blog also recommend using it.
shard-streams.enabled: After adjusting Loki labels, the number of streams may decrease, but the log volume per stream may increase, potentially exceeding the ingester.per-stream-rate-limit. Enabling this parameter splits streams exceeding shard-streams.desired-rate into multiple stream shards. The distributor automatically adds the __stream_shard__ label to these shards, effectively creating distinct streams that the ingester can handle.
ingester.per-stream-rate-limit: If rate limiting persists even with shard-streams.enabled, increase this value, provided the ingester has sufficient resources.
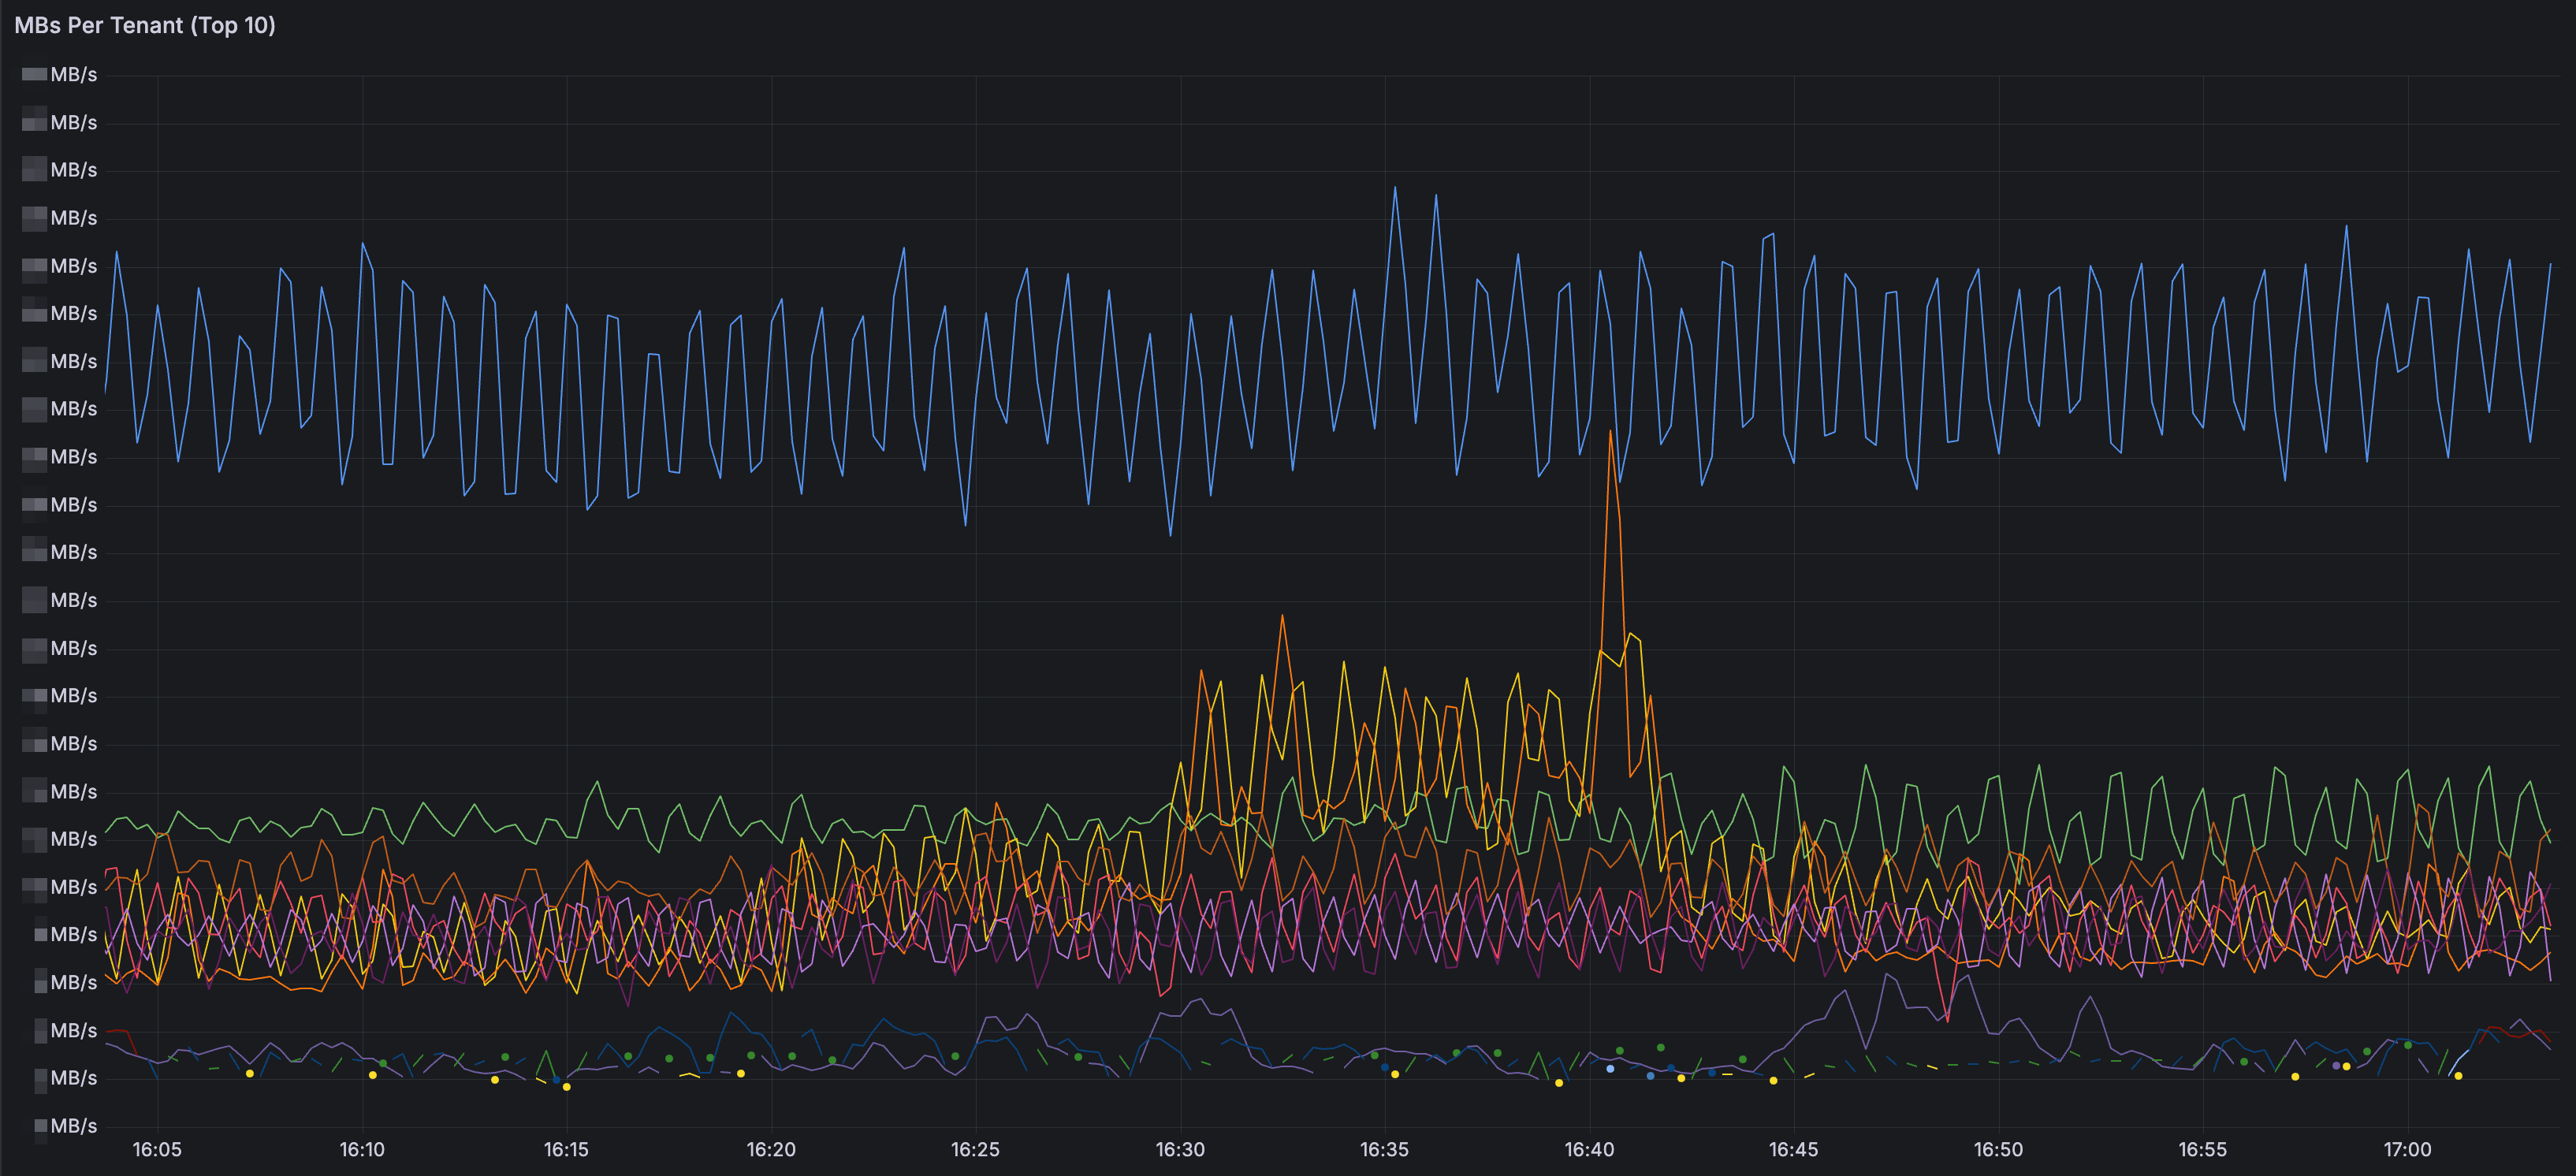
distributor.ingestion-rate-limit-mb: Use the PromQL syntax from the Loki Operational Dashboard (MBs Per Tenant Panel) to sum the log volume for each tenant and calculate a reasonable global rate limit. Update distributor.ingestion-burst-size-mb accordingly.
ingester.max-chunk-age: Although the official blog suggests setting this to 2h, we increased it to 4h after adjusting Loki labels as described in the previous article. We also adjusted ingester.chunks-idle-period to 4h. This extra time allows logs from one-off tasks or scheduled jobs to be written to the same chunk, increasing the likelihood of a "full" Chunk Flush Reason instead of "max age". Another benefit, as mentioned in official blog, is that we can tolerate older out-of-order ingestion. This is helpful if there are misconfigurations in Vector, mistakenly sending error-handling logs to Loki. The extra time allows us to troubleshoot and resolve the issue, preventing Loki from rejecting logs due to out-of-order ingestion. While increasing this parameter slightly increases ingester memory usage, it's less than the memory saved by adjusting Loki labels, making it an acceptable trade-off.
ingester.readiness-check-ring-health: With multiple ingester replicas, restarting the ingester statefulset defaults to checking the health of the ingester ring, which can take up to 10 minutes per ingester. Consider setting this to false to only check the health of the ingester itself, reducing the waiting time to 2 minutes.
distributor.zone-awareness-enabled: This parameter is well-encapsulated in the grafana/loki helm chart's ingester.zoneAwareReplication. As shown below, specifying the number of ingester replicas and affinity allows you to deploy different ingesters evenly across different AZs, achieving higher write availability.
ingester:
replicas: 12
zoneAwareReplication:
  zoneA:
    extraAffinity:
      nodeAffinity:
        requiredDuringSchedulingIgnoredDuringExecution:
          nodeSelectorTerms:
          - matchExpressions:
            - key: nodepool
              operator: In
              values:
              - loki
            - key: availability-zone
              operator: In
              values:
              - az-1
  zoneB:
    ...
  zoneC:
    ...
Distributor
distributor.client-cleanup-period: In the Loki architecture, the distributor periodically requests the log volume of each stream from the ingester as a rate limit reference. Additionally, the distributor updates clients every distributor.client-cleanup-period, removing non-existent ingester connections. During ingester restarts, if the distributor doesn't update connections promptly, it may mistakenly send logs to non-existent ingesters. Consider reducing this period to remove unhealthy connections faster and prevent errors.
distributor.rate-store.ingester-request-timeout: If network instability causes long request times from the distributor to the ingester, resulting in timeouts, slightly increase this value to prevent distributor errors.
Loki Read Config Tuning
Querier
Refer to the official blog for detailed information on Loki querier tuning. The author uses excellent animations to illustrate how querier-related parameters affect query behavior and provides various metrics to help Loki administrators identify current issues.
The following LogQL syntax (adjusted for our use case) was particularly helpful for tuning:
{component="querier", cluster="$cluster", namespace="$namespace"}
  |= "metrics.go"
  | logfmt
  | latency="slow"
  | query_type="metric" or query_type="filter" or query_type="limited"
  | label_format
      duration_s=`{{.duration | duration}}`,
      queue_time_s=`{{.queue_time | duration}}`,
      chunk_refs_s=`{{.chunk_refs_fetch_time | duration}}`,
      chunk_total_s=`{{.store_chunks_download_time | duration}}`,
      cache_download_chunk_s=`{{.cache_chunk_download_time | duration}}`
  | label_format total_time_s=`{{addf .queue_time_s .duration_s}}`
  | label_format
      queue_pct=`{{mulf (divf .queue_time_s .total_time_s) 100 }}`,
      index_pct=`{{mulf (divf (.chunk_refs_fetch_time | duration) .total_time_s) 100 }}`,
      chunks_pct=`{{mulf (divf .chunk_total_s .total_time_s) 100}}`,
      execution_pct=`{{mulf (divf (subf .duration_s .chunk_refs_s .chunk_total_s) .total_time_s) 100}}`,
      cache_download_pct=`{{mulf (divf .cache_download_chunk_s .chunk_total_s) 100}}`,
      avg_chunk_size=`{{divf (divf (bytes .total_bytes) .cache_chunk_req 1000)}}`
  | line_format `| total_time {{printf "%3.0f" (.total_time_s | float64)}}s | queued {{printf "%3.0f" (.queue_pct | float64)}}% | execution {{printf "%3.0f" (.execution_pct | float64)}}% | index {{printf "%3.0f" (.index_pct | float64)}}% | store {{printf "%3.0f" (.chunks_pct | float64)}}% (cache {{ printf "%3.0f" (.cache_download_pct | float64) }}%) | avg_chunk {{printf "%3.0f" (.avg_chunk_size | float64)}}kB | {{ .query }}`
This displays the time spent in four different phases when the querier executes a slow query (execution time greater than 10 seconds) during subquery execution:
queued: Time spent waiting in the queue.
index: Time spent searching the index based on Loki labels.
store: Time spent retrieving chunks from cache or object storage after obtaining the index.
execution: Time spent executing the query in the querier after retrieving the chunks.
Aim for the highest possible execution ratio (over 80%), indicating that the querier is spending CPU time calculating results rather than waiting for I/O. The blog provides guidance on adjusting configurations if query time is spent in other phases.
We've also customized the store presentation by adding a cache metric, representing the time the querier spends retrieving chunks from the cache. This ratio should be as close to 100% as possible, indicating that chunk retrieval primarily occurs from the faster cache rather than the much slower object storage. This helped us identify that our previous chunk cache was inefficient and required further tuning, which will be discussed later.
Chunk Cache
If you've read this official blog post, you might consider replacing Loki's chunk cache with Memcached and using extstore to mount fast SSDs. This provides more space and cost-effectively improves Loki query performance. We also attempted to calculate the hot query intervals using LogQL, as described in the article. While the article doesn't provide the exact query syntax, we used the following LogQL with a heatmap:
sum_over_time({cluster="$cluster", namespace="$namespace", app="loki", component="query-frontend"} |= "metrics.go"
  |= "query_type" | logfmt | query_type="metric" or query_type="filter" or query_type="limited"
  | unwrap duration(start_delta)[5m])
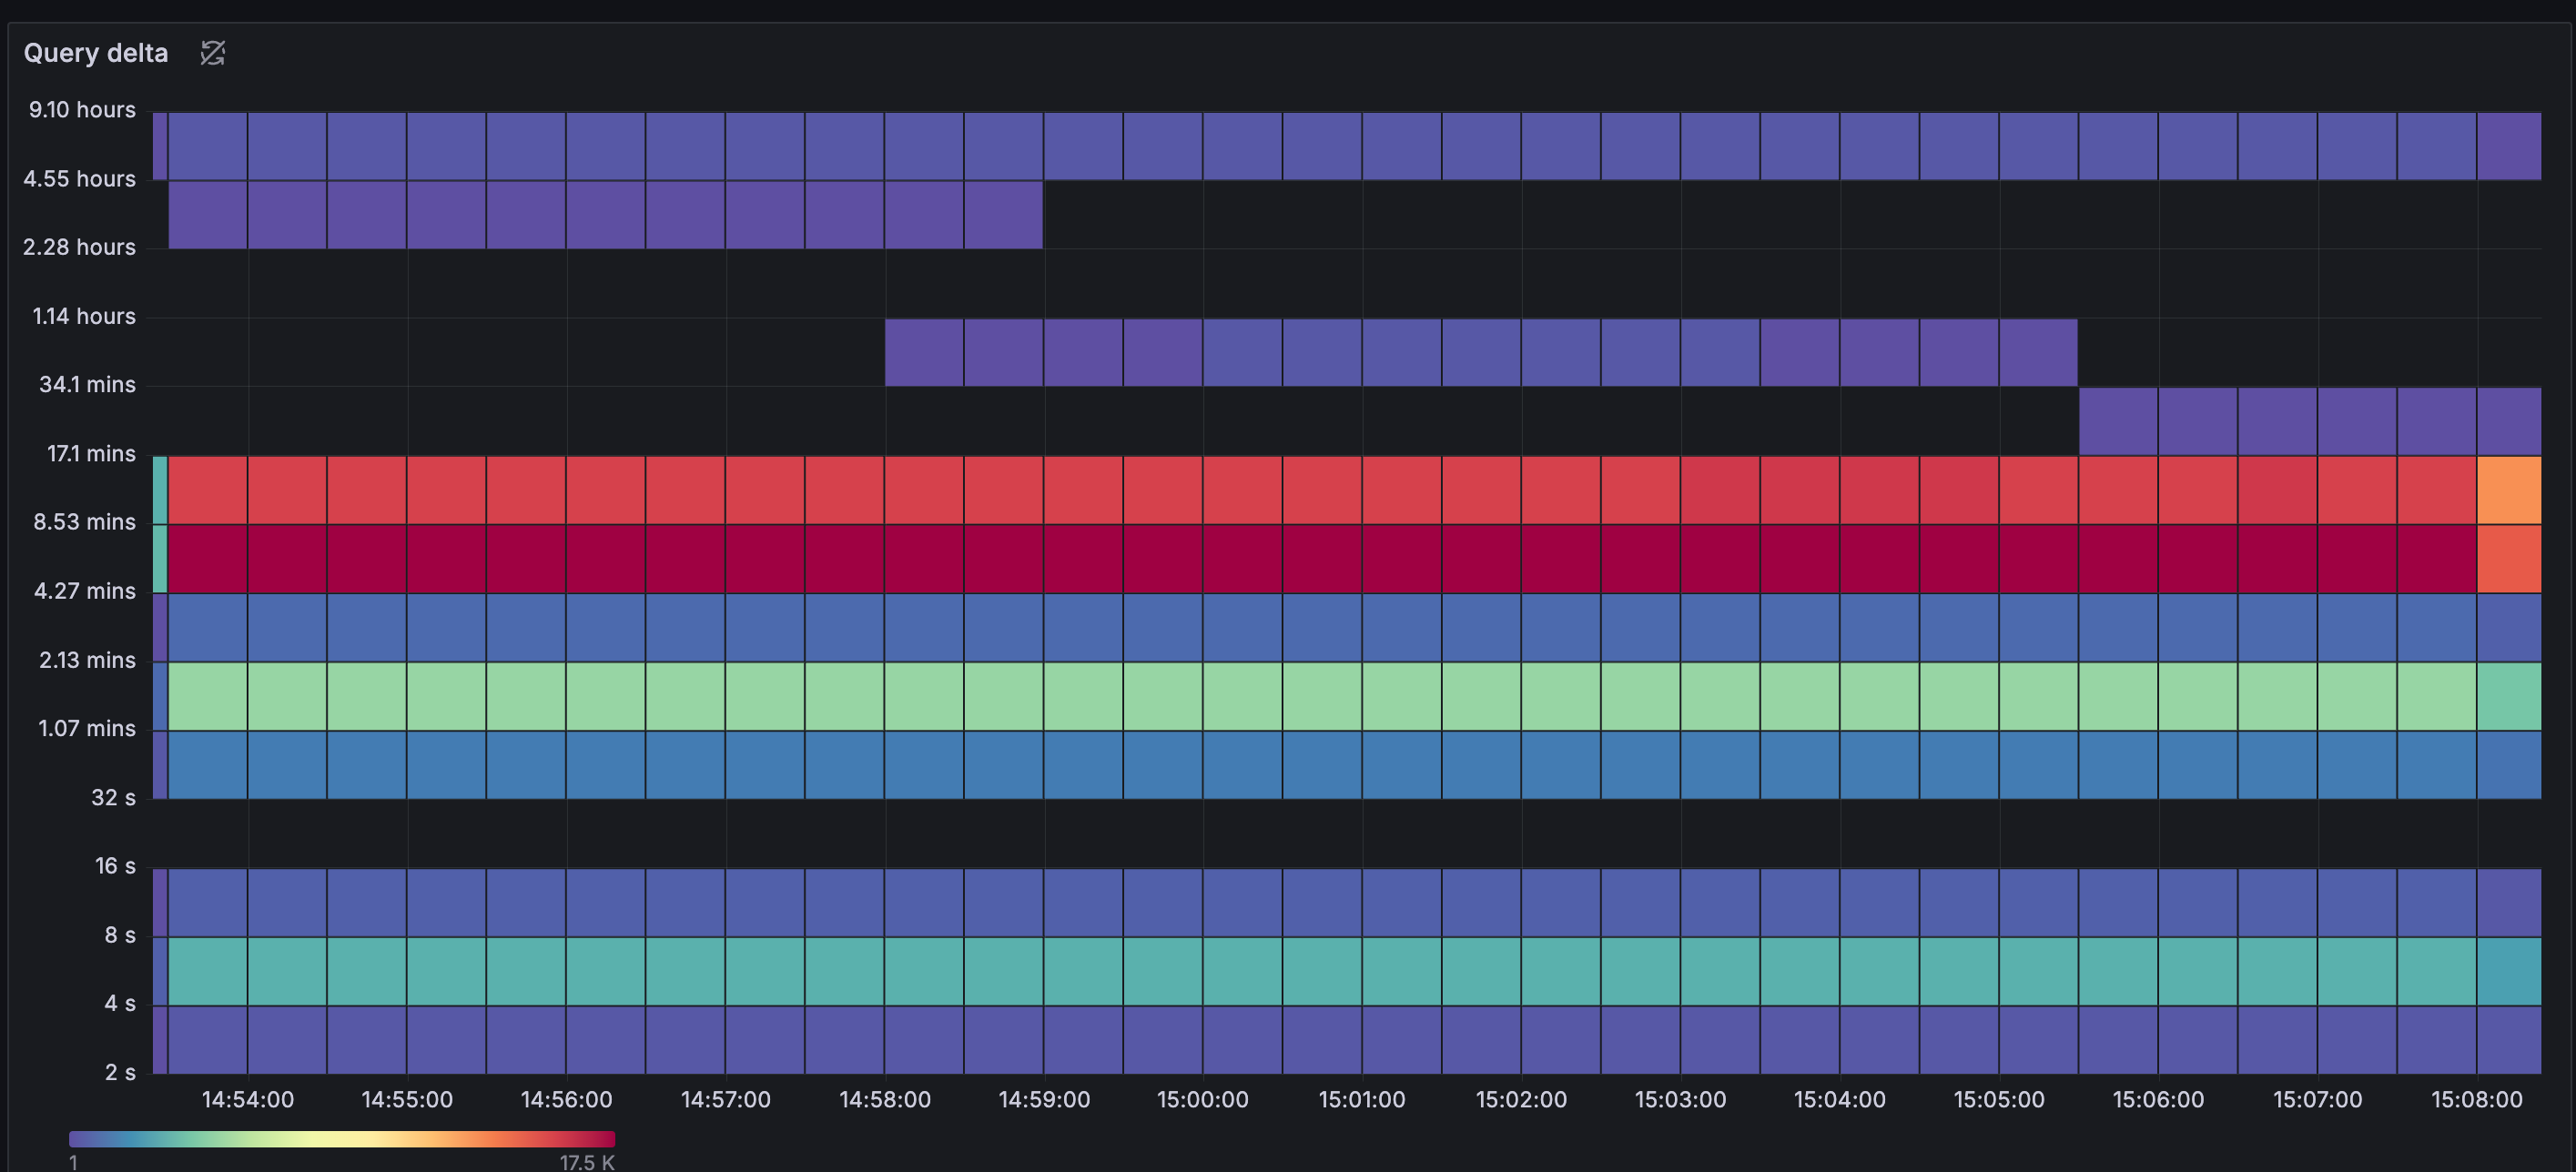
The heatmap below shows that most query intervals fall within the past 9 hours. After discussion, we decided that the cache should retain at least one day's worth of chunks and calculated the required cache space accordingly.
Our old Loki used Redis as a chunk cache. The current grafana/loki helm chart has excellent support for Memcached, so we decided to apply these settings to the new Loki. However, the results were not as expected.
Using the LogQL syntax mentioned earlier, we found that the querier spent over 30% of its time in the store phase, and the cache phase ratio was less than 50%. This meant we were spending time waiting for chunk downloads from both the cache and object storage, which contradicted our expectation of a near 100% cache phase ratio and minimal store phase ratio.
After enabling Loki's Jaeger tracing feature, we discovered that the querier spent over 10 seconds retrieving chunks from the cache. Combined with the execution phase time, we frequently encountered timeout issues.
Fortunately, we found a solution on the official memcached GitHub. The following are the official recommended Memcached settings:
Keep ingester.chunk-target-size and the maximum item size in Memcached (-I parameter) relatively small (e.g., 2MB). Also, add the special extstore parameters to Memcached.
memcached -m 6000 -I 2m \
	-o ext_path=/disk/extstore:500G,ext_wbuf_size=32,ext_threads=10,ext_max_sleep=10000,slab_automove_freeratio=0.10,ext_recache_rate=0
In the Loki configuration, set small batch sizes and parallelism, and increase the timeout.
store.chunks-cache.memcached.batchsize determines how many Memcached keys the Memcached client retrieves at once. Set this to twice the number of Memcached servers.
store.chunks-cache.memcached.parallelism determines how many Go routines simultaneously retrieve Memcached keys. Set this to the lowest possible value, but increase it if network bandwidth allows.
store.chunks-cache.memcached.timeout includes the time for Memcached to retrieve the cache and the serialization time. Large chunk item sizes or batch sizes can affect the timeout. The default is 100ms, but it's strongly recommended to increase it to a higher value, such as 60s.
Loki's memcache client timeout is measuring the amount of time to fetch and read and process the entire batch of keys from each host.
store.background.write-back-concurrency represents the number of Go routines writing to Memcached. Set this to 1 to avoid aggressively writing to Memcached, which can cause some items to be evicted.
chunk_store_config:
chunk_cache_config:
  memcached:
    batch_size: 3
    parallelism: 2
  memcached_client:
    addresses: 127.0.0.1:11211
    timeout: 60s
  background:
    writeback_goroutines: 1
    writeback_buffer: 1000
    writeback_size_limit: 500MB
Results
Write Performance
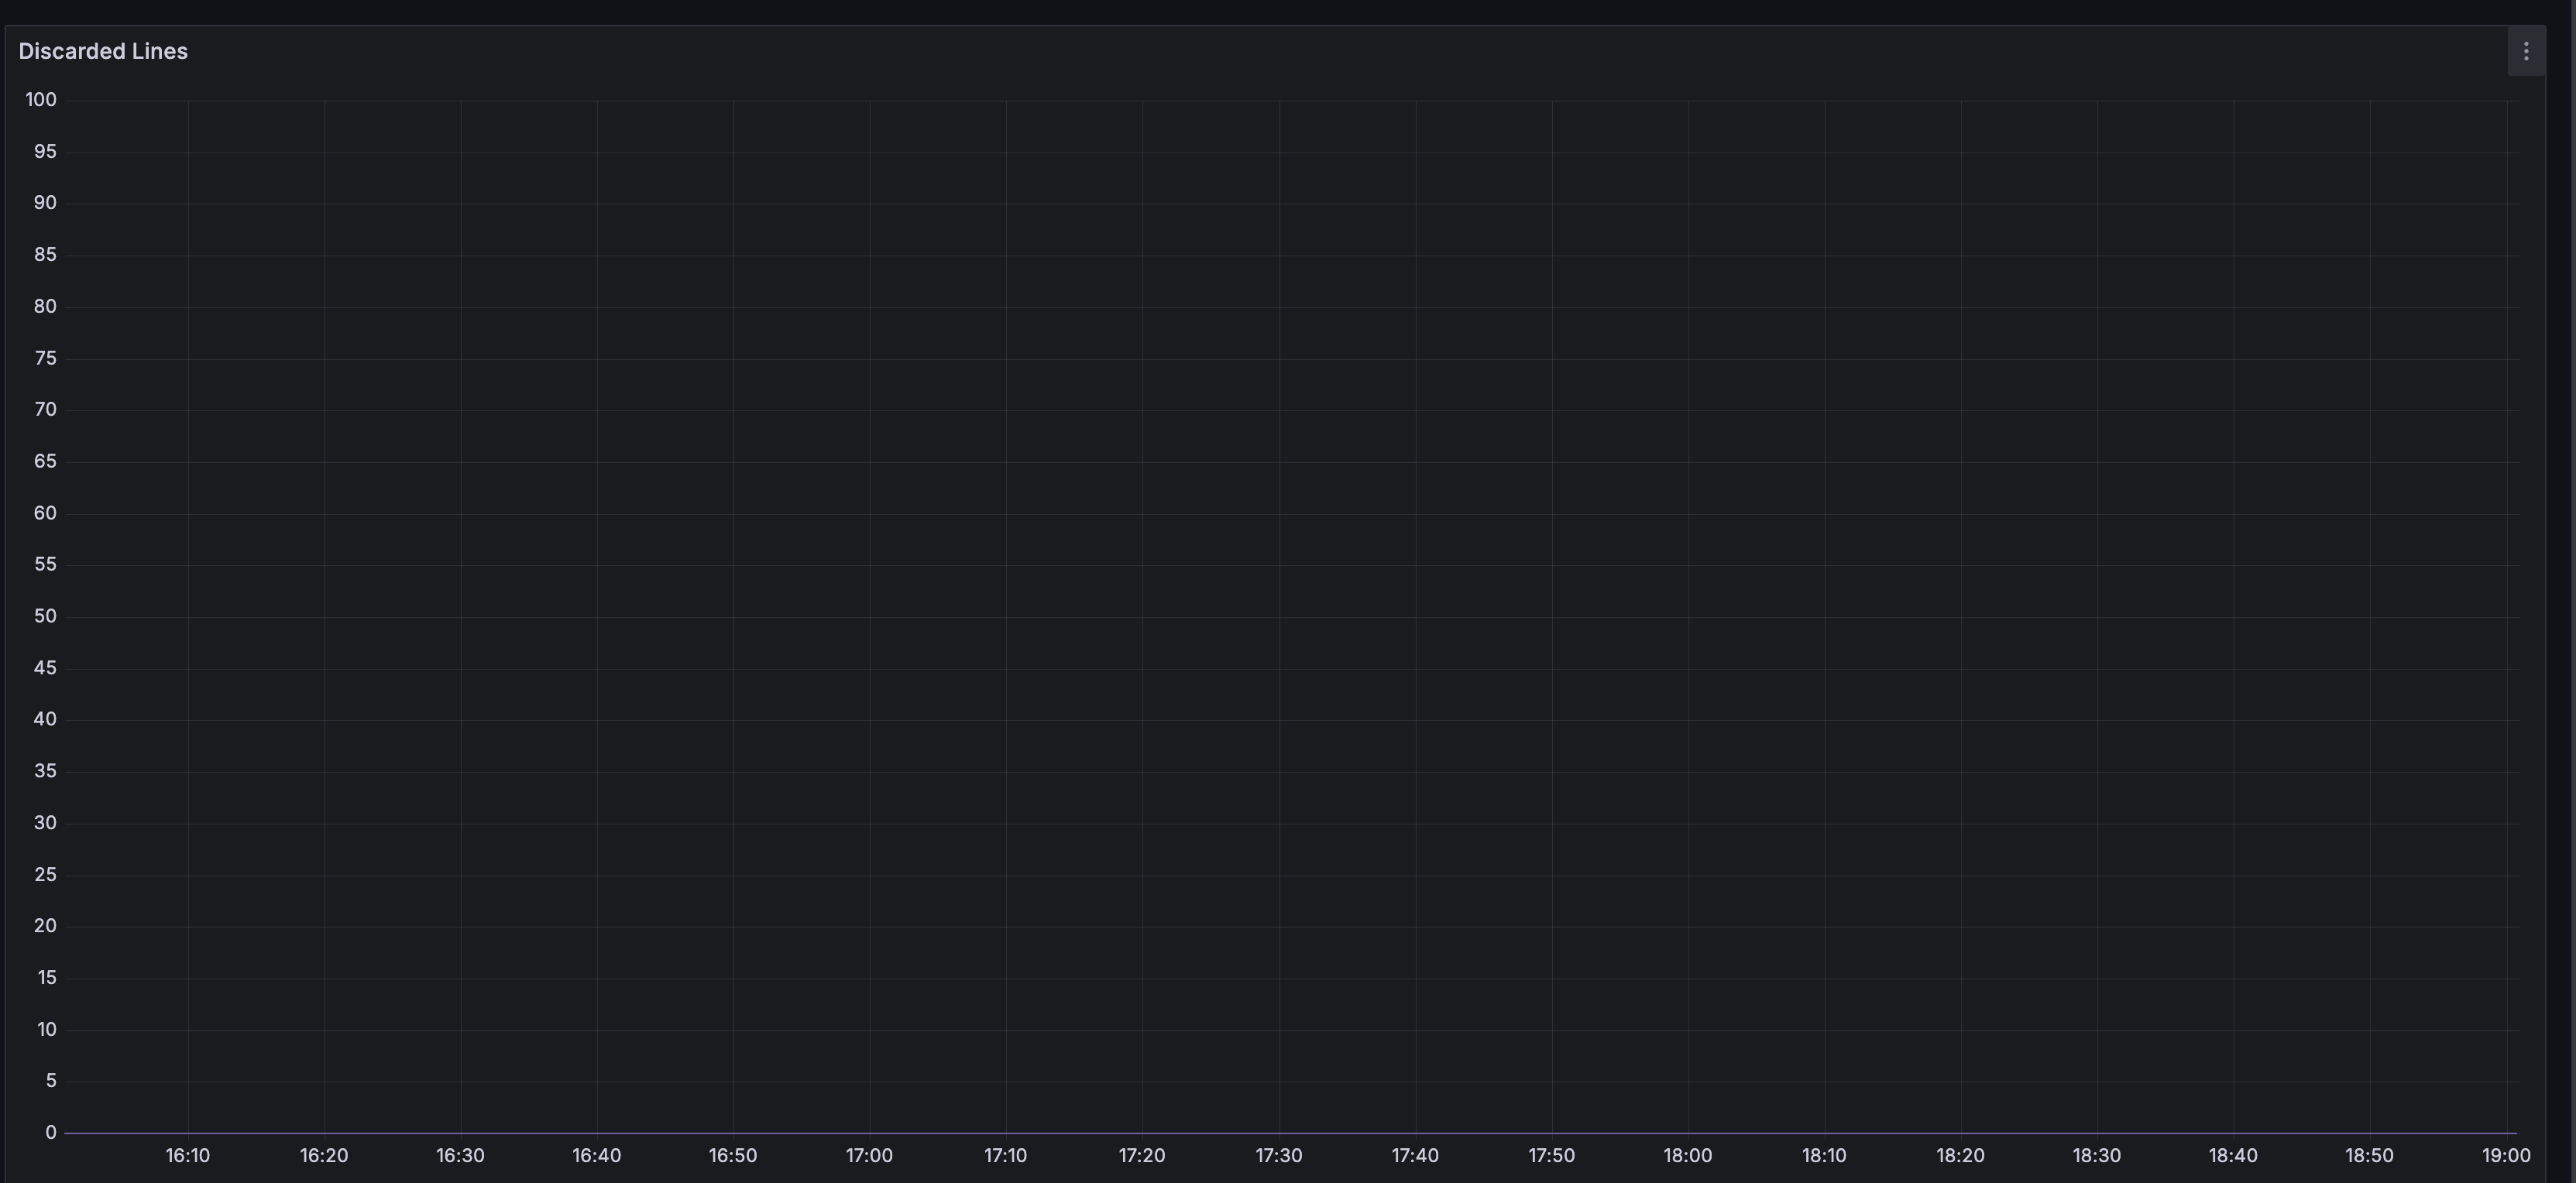
The graph below shows that Loki no longer discards incoming logs due to rate limiting at the distributor end. This is because the ingester has sufficient write performance, combined with appropriate distributor rate limit and shard-streams adjustments.
Query Performance
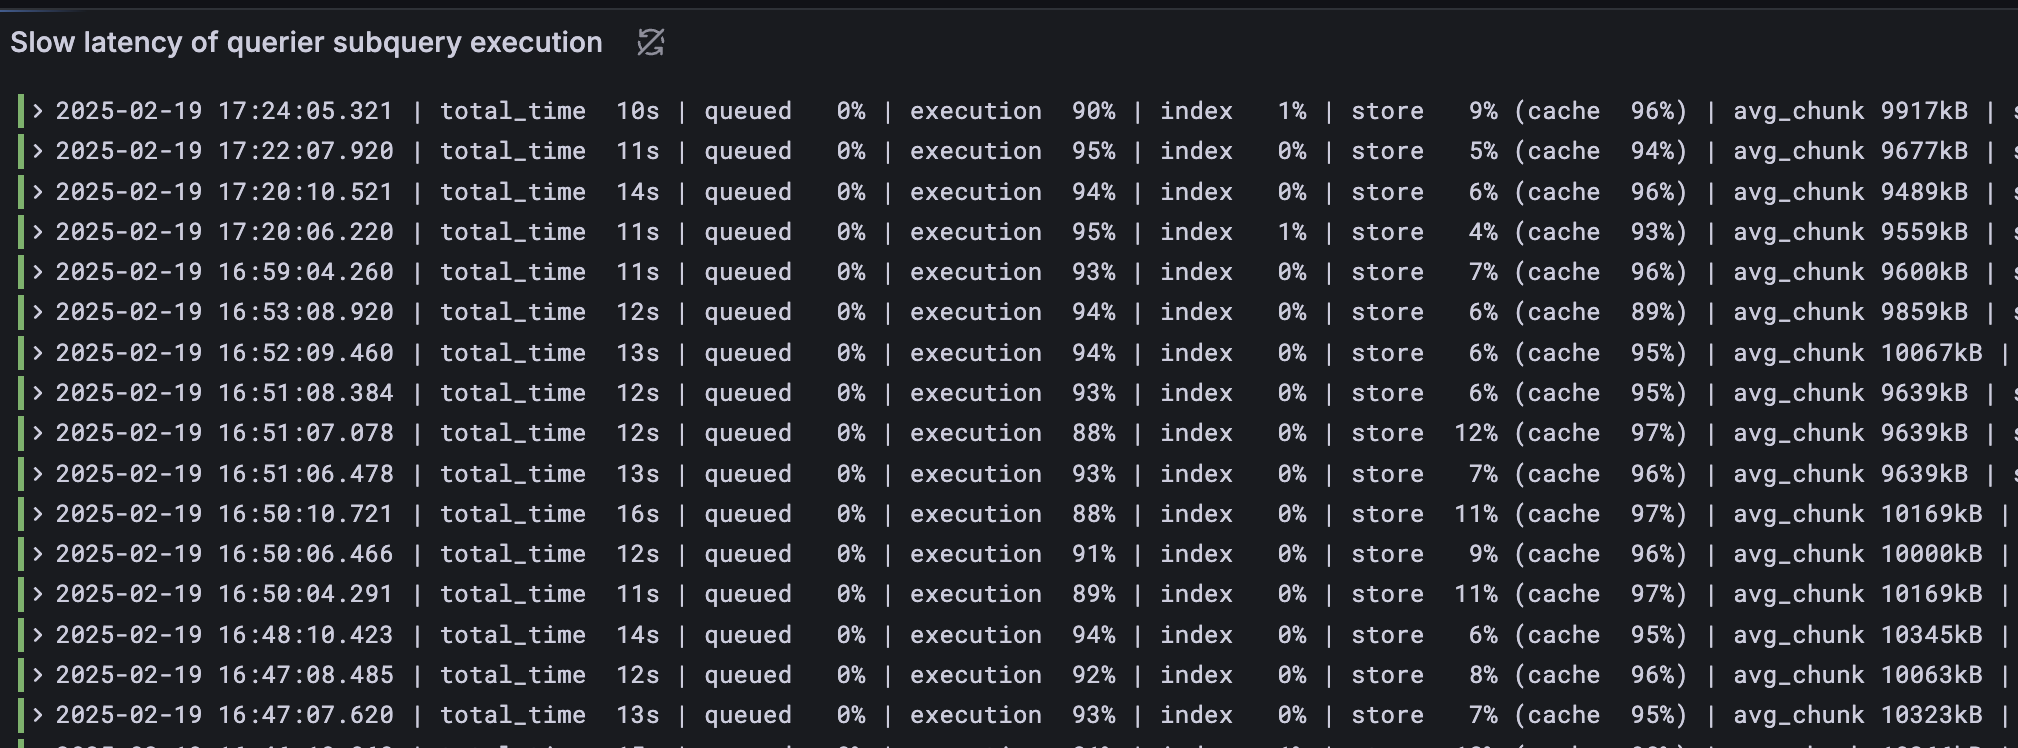
The following is the execution result of the modified official LogQL mentioned earlier. Even for slow subqueries, the execution phase accounts for over 90% of the execution time, and the cache portion accounts for over 95%. This confirms that chunks are primarily retrieved from the cache, saving time for calculating the final LogQL results.
There's still room for improvement in the execution phase, potentially by increasing the number of querier replicas, increasing CPU resources, or improving LogQL syntax to further accelerate search times.
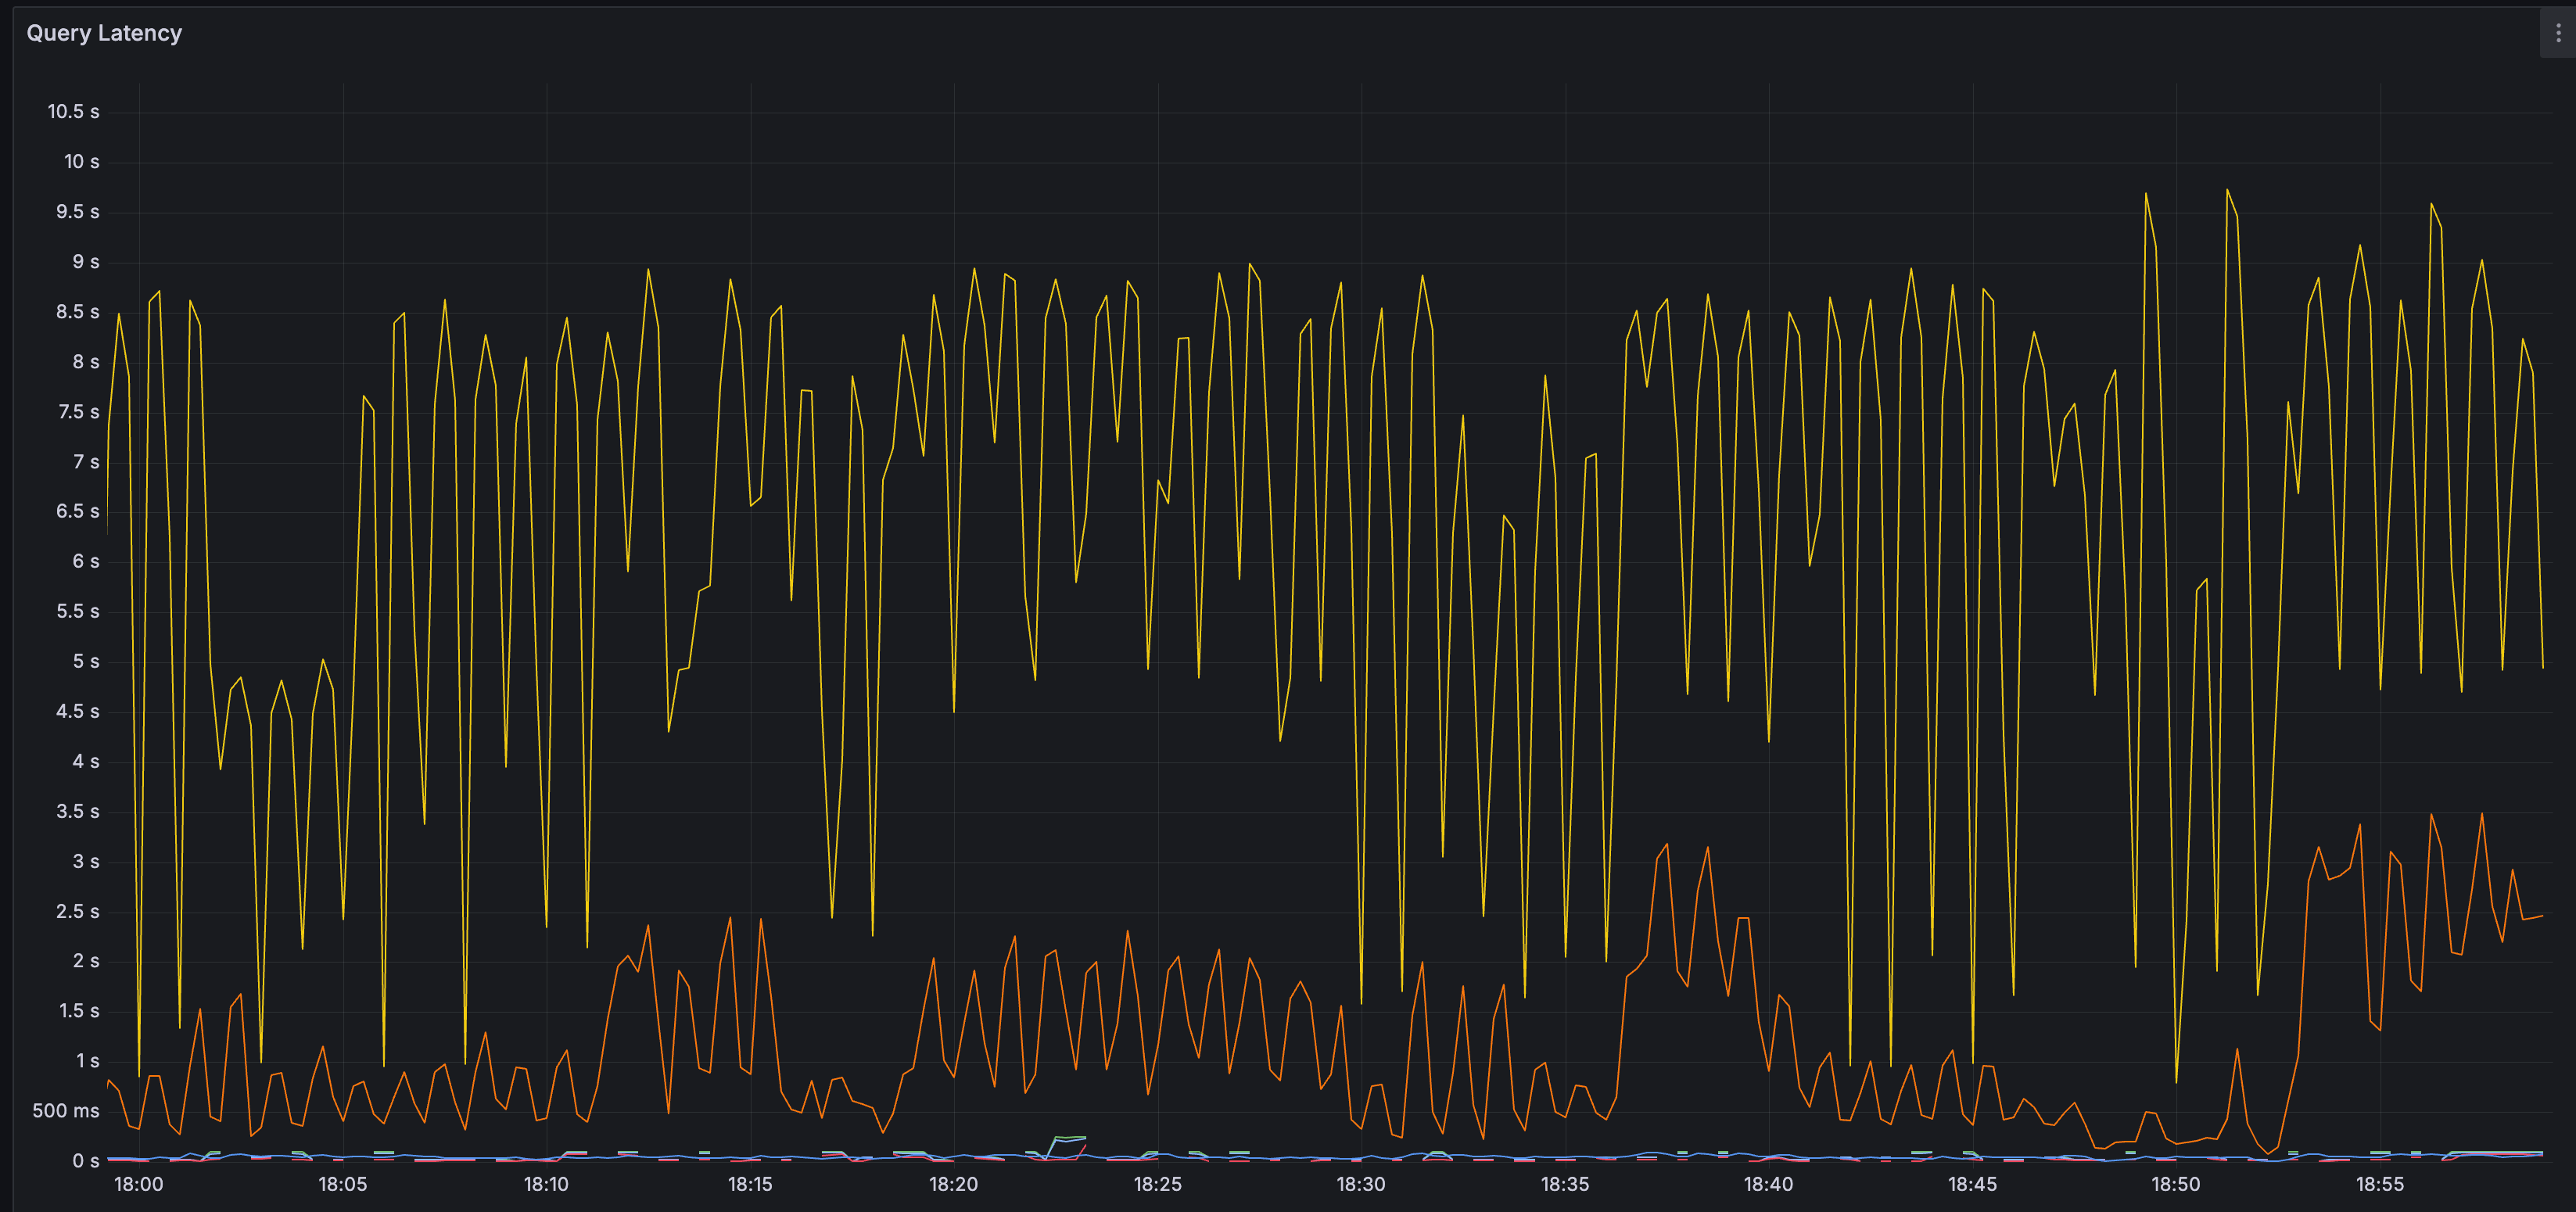
The graph below shows the query time over time. The yellow line represents the 99th percentile, and the orange line represents the 90th percentile. Most query times are less than 10 seconds.
Cache Performance
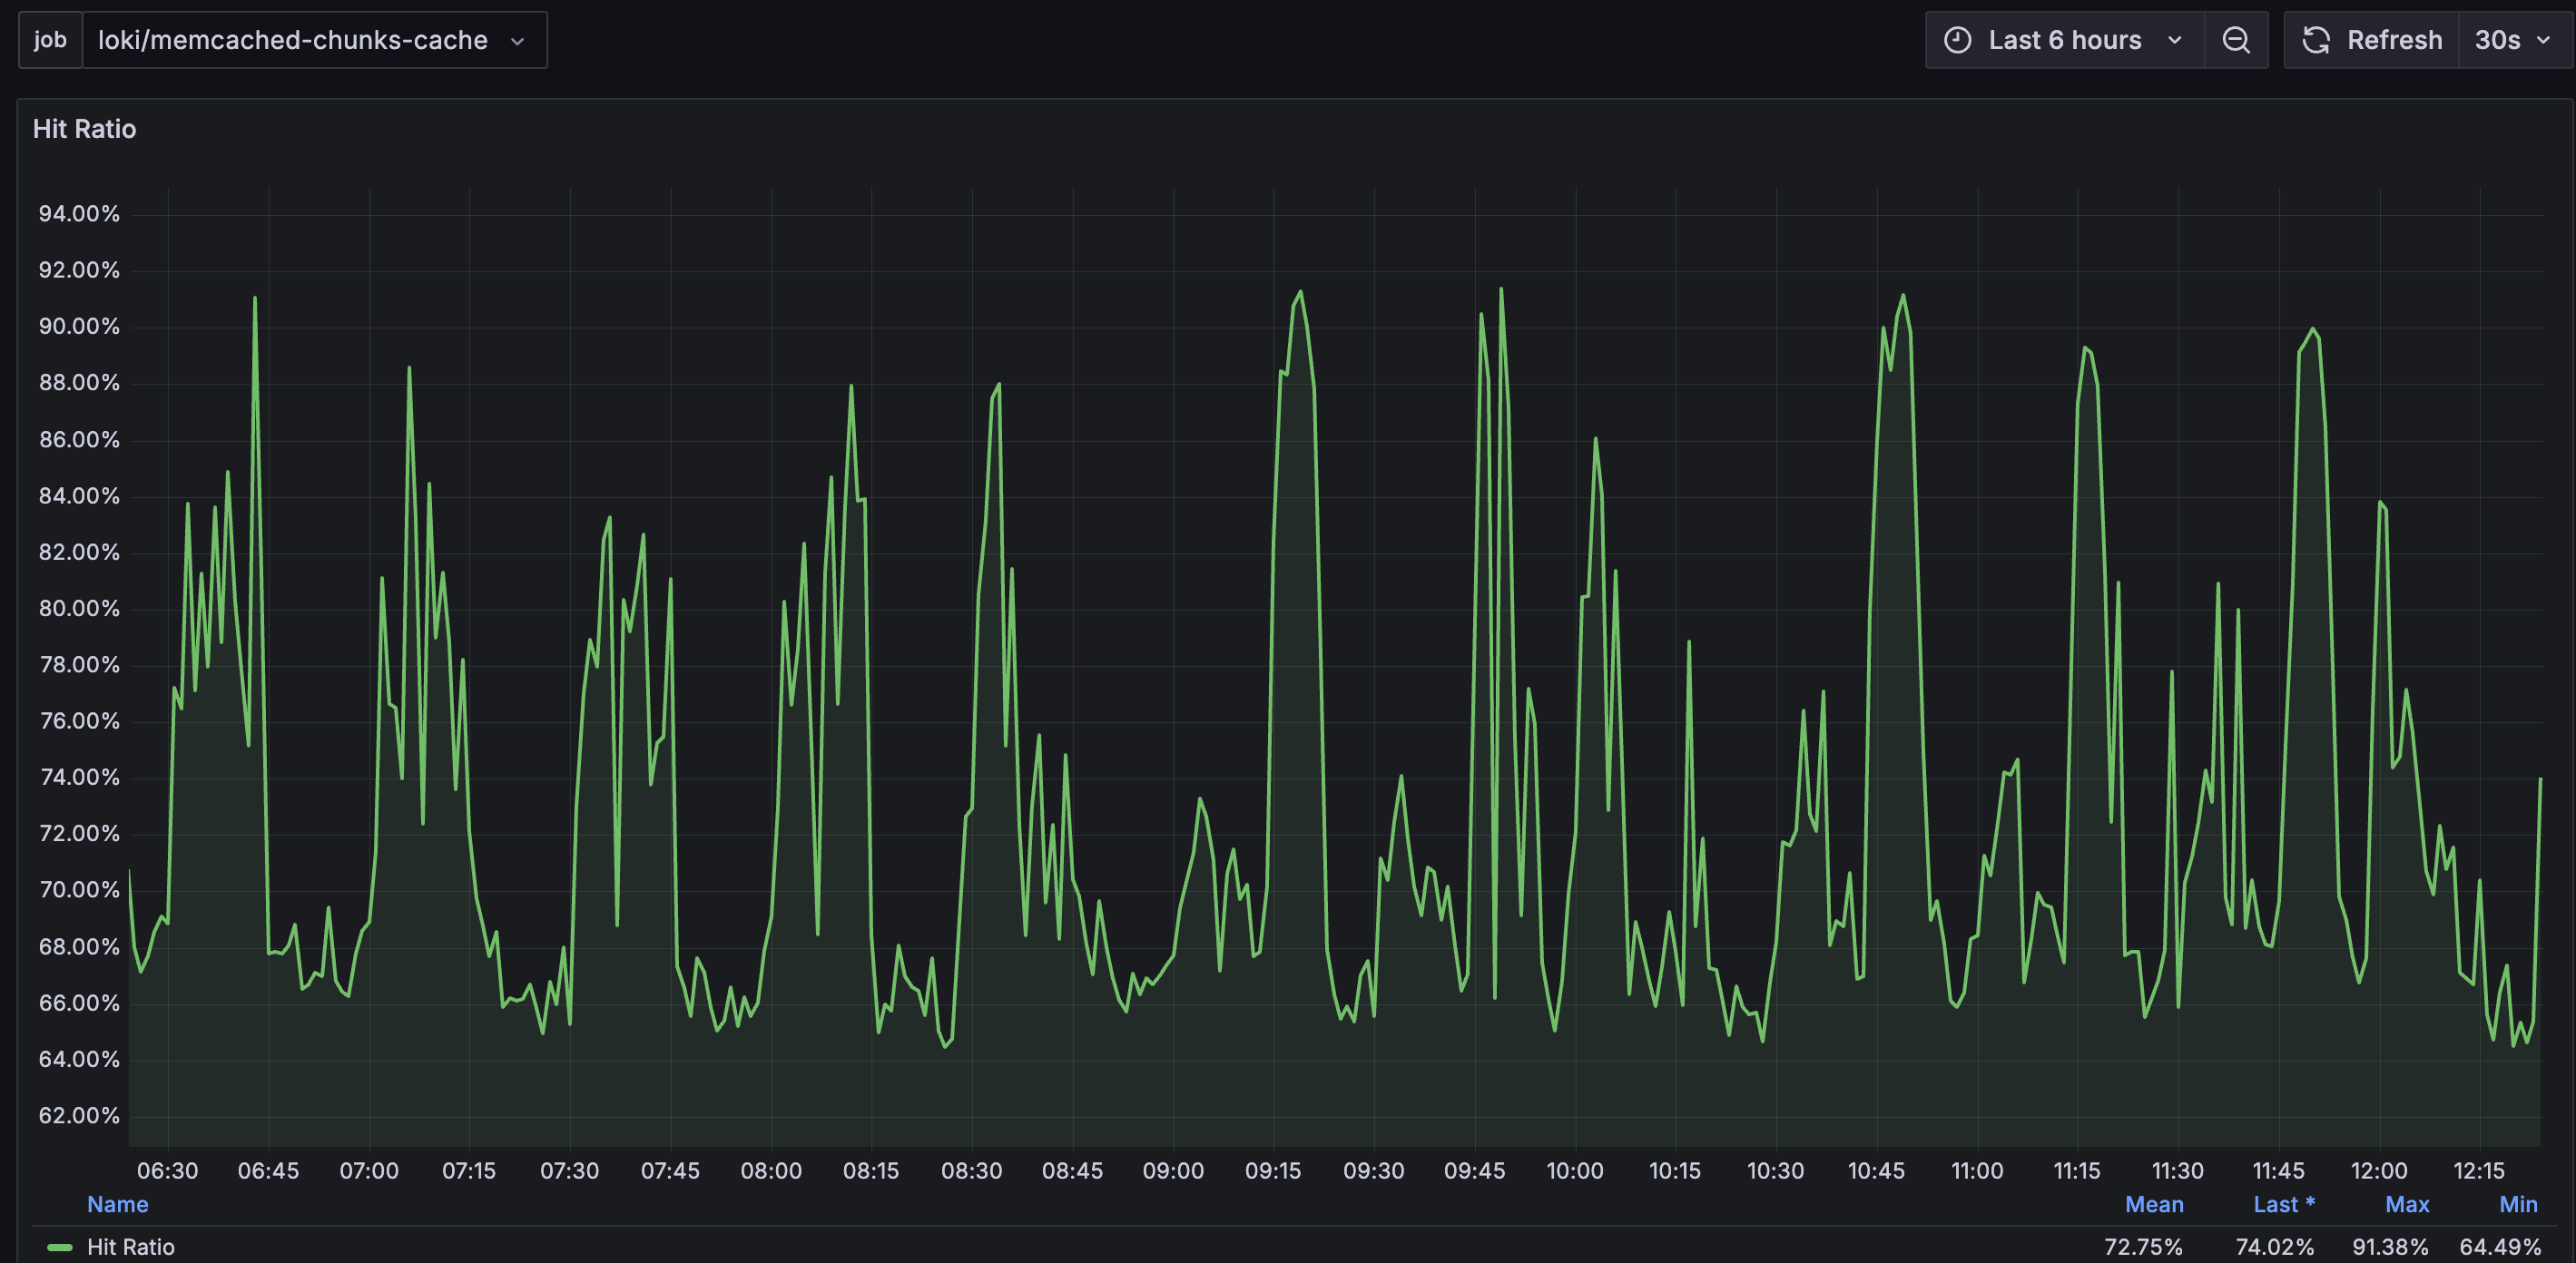
The chunk cache hit rate remains above 70% most of the time. This prevents Loki from retrieving chunks from the much slower Object Storage and reduces the load on Object Storage.
Conclusion
In this article, we focused on Loki configuration tuning. We explained why write performance should be prioritized, as it affects read performance. We then covered the detailed configuration settings for the components responsible for writing and reading in Loki. We especially thank Grafana and Memcached for providing technical articles that guided our adjustments.
The final result is that we can receive logs from the log collector as much as possible during writing, and we can fully utilize the cache during querying, reducing the load on Object Storage. The results are satisfactory. We will continue to improve the performance of the log collector and Loki to provide Loki users with a better user experience.