Generated by Microsoft Designer
TLDR
- At LINE Taiwan, we decided to upgrade Loki using a canary deployment strategy.
- Replaced Promtail with Vector to handle logs and send them to Loki.
- Used Vector to replicate real traffic to the new Loki, helping us adjust Loki configurations.
- Improved Loki labels with Vector, significantly enhancing Loki's performance.
- Ultimately saved nearly 70% in machine costs, minimizing backend storage burden.
Background
Observability Platform
LINE Taiwan's observability platform primarily uses the Grafana ecosystem, utilizing Grafana as a dashboard and a medium for searching logs, metrics, and traces. For metrics, we use a Prometheus API-compatible system provided by the company. For logs, we use a self-built Loki cluster, and for traces, we use a self-built Tempo cluster.
At that time, our Loki cluster version was 2.8, deployed using the grafana/loki-distributed helm chart, with backend storage using an S3 API-compatible Object Storage system provided by the company. Notably, we set up 10 sharding buckets according to the Loki config to distribute bucket traffic. The Loki's cache used the company's Redis Service. Due to the numerous projects and teams, we enabled the multi-tenant setting.
Loki Upgrade
At the end of last year, the SRE team planned to upgrade the Loki cluster to version 3.3. By then, Loki had an officially maintained grafana/loki helm chart, and the installation documentation directly used this helm chart for installation, no longer relying on the community-maintained grafana/loki-distributed helm chart. The official Loki documentation also mentioned how to migrate from the grafana/loki-distributed helm chart to the grafana/loki helm chart, suggesting that the old helm chart would be deprecated. After reviewing the official migration process, we found it inconvenient to implement. Considering various factors and the sufficient resources of the observability cluster, we decided to build a second new Loki cluster using the grafana/loki helm chart, hoping to solve the existing Loki issues through new architecture, processes, and configurations.
When designing the migration process, we aimed to let the new Loki cluster handle production traffic directly and tune Loki's configuration during the process. Once the performance tuning was satisfactory, we could gradually announce it for beta and production use. Therefore, designing a smooth migration process was our primary goal, which is the focus of this article. Detailed Loki configuration adjustments will be discussed in the next article.
Method
Migrating from Promtail to Vector
As mentioned earlier, we wanted to run two Loki clusters concurrently during the migration, both receiving the same logs, which required effort on the log collector side. At that time, we used Grafana's Promtail. Although Promtail could set a second Loki endpoint, its configuration was hard to maintain, and the official documentation stated that Promtail was no longer accepting updates, focusing instead on the development of Alloy.
When considering which log collector to replace, we evaluated the following needs:
- Properly collect Kubernetes logs with basic k8s metadata.
- Allow sending logs to Loki.
- Perform basic log processing, such as masking sensitive data or adjusting Loki labels.
Although Alloy met these requirements and we had used it in other scenarios, we recalled that our lead mentioned Vector was popular. After evaluating its features, we found it not only met our current needs, but also had the following advantages:
- Developed in Rust, requiring fewer resources to run compared to Promtail or Alloy developed in Golang.
- Rich ecosystem of Vector Components, allowing us to choose suitable components based on the environment and scenario.
- Provided the Vector Remap Language (VRL) syntax, supporting numerous functions, making it easy to process logs as needed.
- Offered convenient Unit Tests to verify the correctness of VRL scripts.
We decided to replace Promtail with Vector, following this process:
- Migrate the existing Promtail configuration to Vector configuration: This included the Kubernetes logs source, Loki sink, and custom Remap transform components. We also wrote multiple Unit Tests to ensure the Vector configuration worked correctly.
sources:
  kubernetes_logs:
    type: kubernetes_logs

transforms:
  add_metadata:
    type: "remap"
    inputs:
    - kubernetes_logs
    source: |
      # custom transformation by VRL

sinks:
  loki:
    type: loki
    inputs: [ add_metadata ]
    endpoint: "${LOKI_ENDPOINT}"
    tenant_id: "{{ .tenant_id }}"
    encoding:
      codec: raw_message
    labels:
      "*": "{{ .loki_labels }}"
- Replace Promtail with Vector: Our replacement process was as follows:
- First, synchronize Vector, during which the old Loki would temporarily handle double the traffic (Promtail + Vector).
- Remove Promtail to avoid Loki's rate limit errors affecting Vector.
- Use Vector's own retry mechanism to send logs to Loki normally.
After the replacement, we observed that not only did Loki operate normally, but Vector also required less than 30% of the memory usage compared to Promtail, validating Vector's high performance.
Gradually Increasing Sample Log Traffic
Vector provides the Sample transform feature, allowing us to set a sample rate to sample incoming logs. This is generally used in scenarios with extremely high log volumes, setting a small but sufficient sample rate for troubleshooting, reducing the burden on the log system and backend storage. However, we decided to leverage this feature to help us smoothly migrate Loki. The specific process is as follows:
- Define the Sample transform, inputting the
add_metadatacomponent processed by VRL. The following example uses a 10% (1/10) sample rate.
transforms:
  add_metadata:
    type: "remap"
    inputs:
    - kubernetes_logs
    source: |
      # custom transformation by VRL

  sample_log:
    type: sample
    inputs:
    - add_metadata
    rate: 10
- Define a new Loki sink, changing the
endpointto the new Loki and the input to thesample_logcomponent name. In the following example,loki-v3is the new Loki sink, and its input issample_loginstead ofadd_metadata.
sinks:
  loki:
    type: loki
    inputs: [ add_metadata ]
    endpoint: "${LOKI_ENDPOINT}"
    tenant_id: "{{ .tenant_id }}"
    encoding:
      codec: raw_message
    labels:
      "*": "{{ .loki_labels }}"
  loki-v3:
    type: loki
    inputs: [ sample_log ]
    endpoint: "${LOKI_V3_ENDPOINT}"
    tenant_id: "{{ .tenant_id }}"
    encoding:
      codec: raw_message
    labels:
      "*": "{{ .loki_labels }}"
-
Synchronize the Vector configuration to the cluster, confirming that the new Loki is receiving a small amount of logs from the real environment. At this point, we can focus on tuning Loki.
-
As Loki tuning progresses, gradually increase the sample rate from 10%, 33%, 50% to the final 100%, proving that the new Loki can robustly handle production log traffic.
Improving Loki Labels
When using Promtail as the log collector, we set the following labels:
- cluster: k8s cluster name
- namespace: k8s namespace
- container: pod container name defined in
spec.containers.name - app:
app.kubernetes.io/name,apppod labels, or pod name - component:
app.kubernetes.io/componentorcomponentpod labels - instance:
app.kubernetes.io/instanceorinstancepod labels - nodename: node name where the pod is deployed
- pod: pod name
- stream: log is
stderrorstdout
After thoroughly reading The concise guide to Grafana Loki: Everything you need to know about labels, we realized that our current label design was very inefficient for Loki storage and search. Therefore, we decided to significantly improve the labels.
We decided to remove high cardinality labels like pod and nodename and place them in structured metadata. Although its retrieval speed is not as fast as labels, this approach aligns with official recommendations and can potentially speed up searches by introducing Bloom Filters. We also added labels like availability_zone, nodepool, and trace_id to aid in log searches.
We made special adjustments to the app label. Besides the aforementioned app-related pod labels, if the pod had a parent resource (e.g., daemonset, statefulset, or deployment), we extracted the pod owner's field, processed it, and wrote it into the app label.
We also made special adjustments for pods generated by k8s client libraries or controllers. These are usually one-time job tasks or pods without parent resources but with complex suffixes in their names. In such cases, we need to actively check which app labels have not been processed. The following logcli command can help identify streams with unprocessed labels in different Loki tenants.
export LOKI_ADDR=<loki-gateway>
export LOKI_ORG_ID=<tenant-id>
logcli series '{}'
After these operations, we expected to see two significant changes in the Loki Operational Dashboard.
Streams
The results below show that the number of streams written decreased significantly from a peak of 20K to 3K. This change in stream numbers will improve chunk utilization, as explained later.
| Before | After |
|---|---|
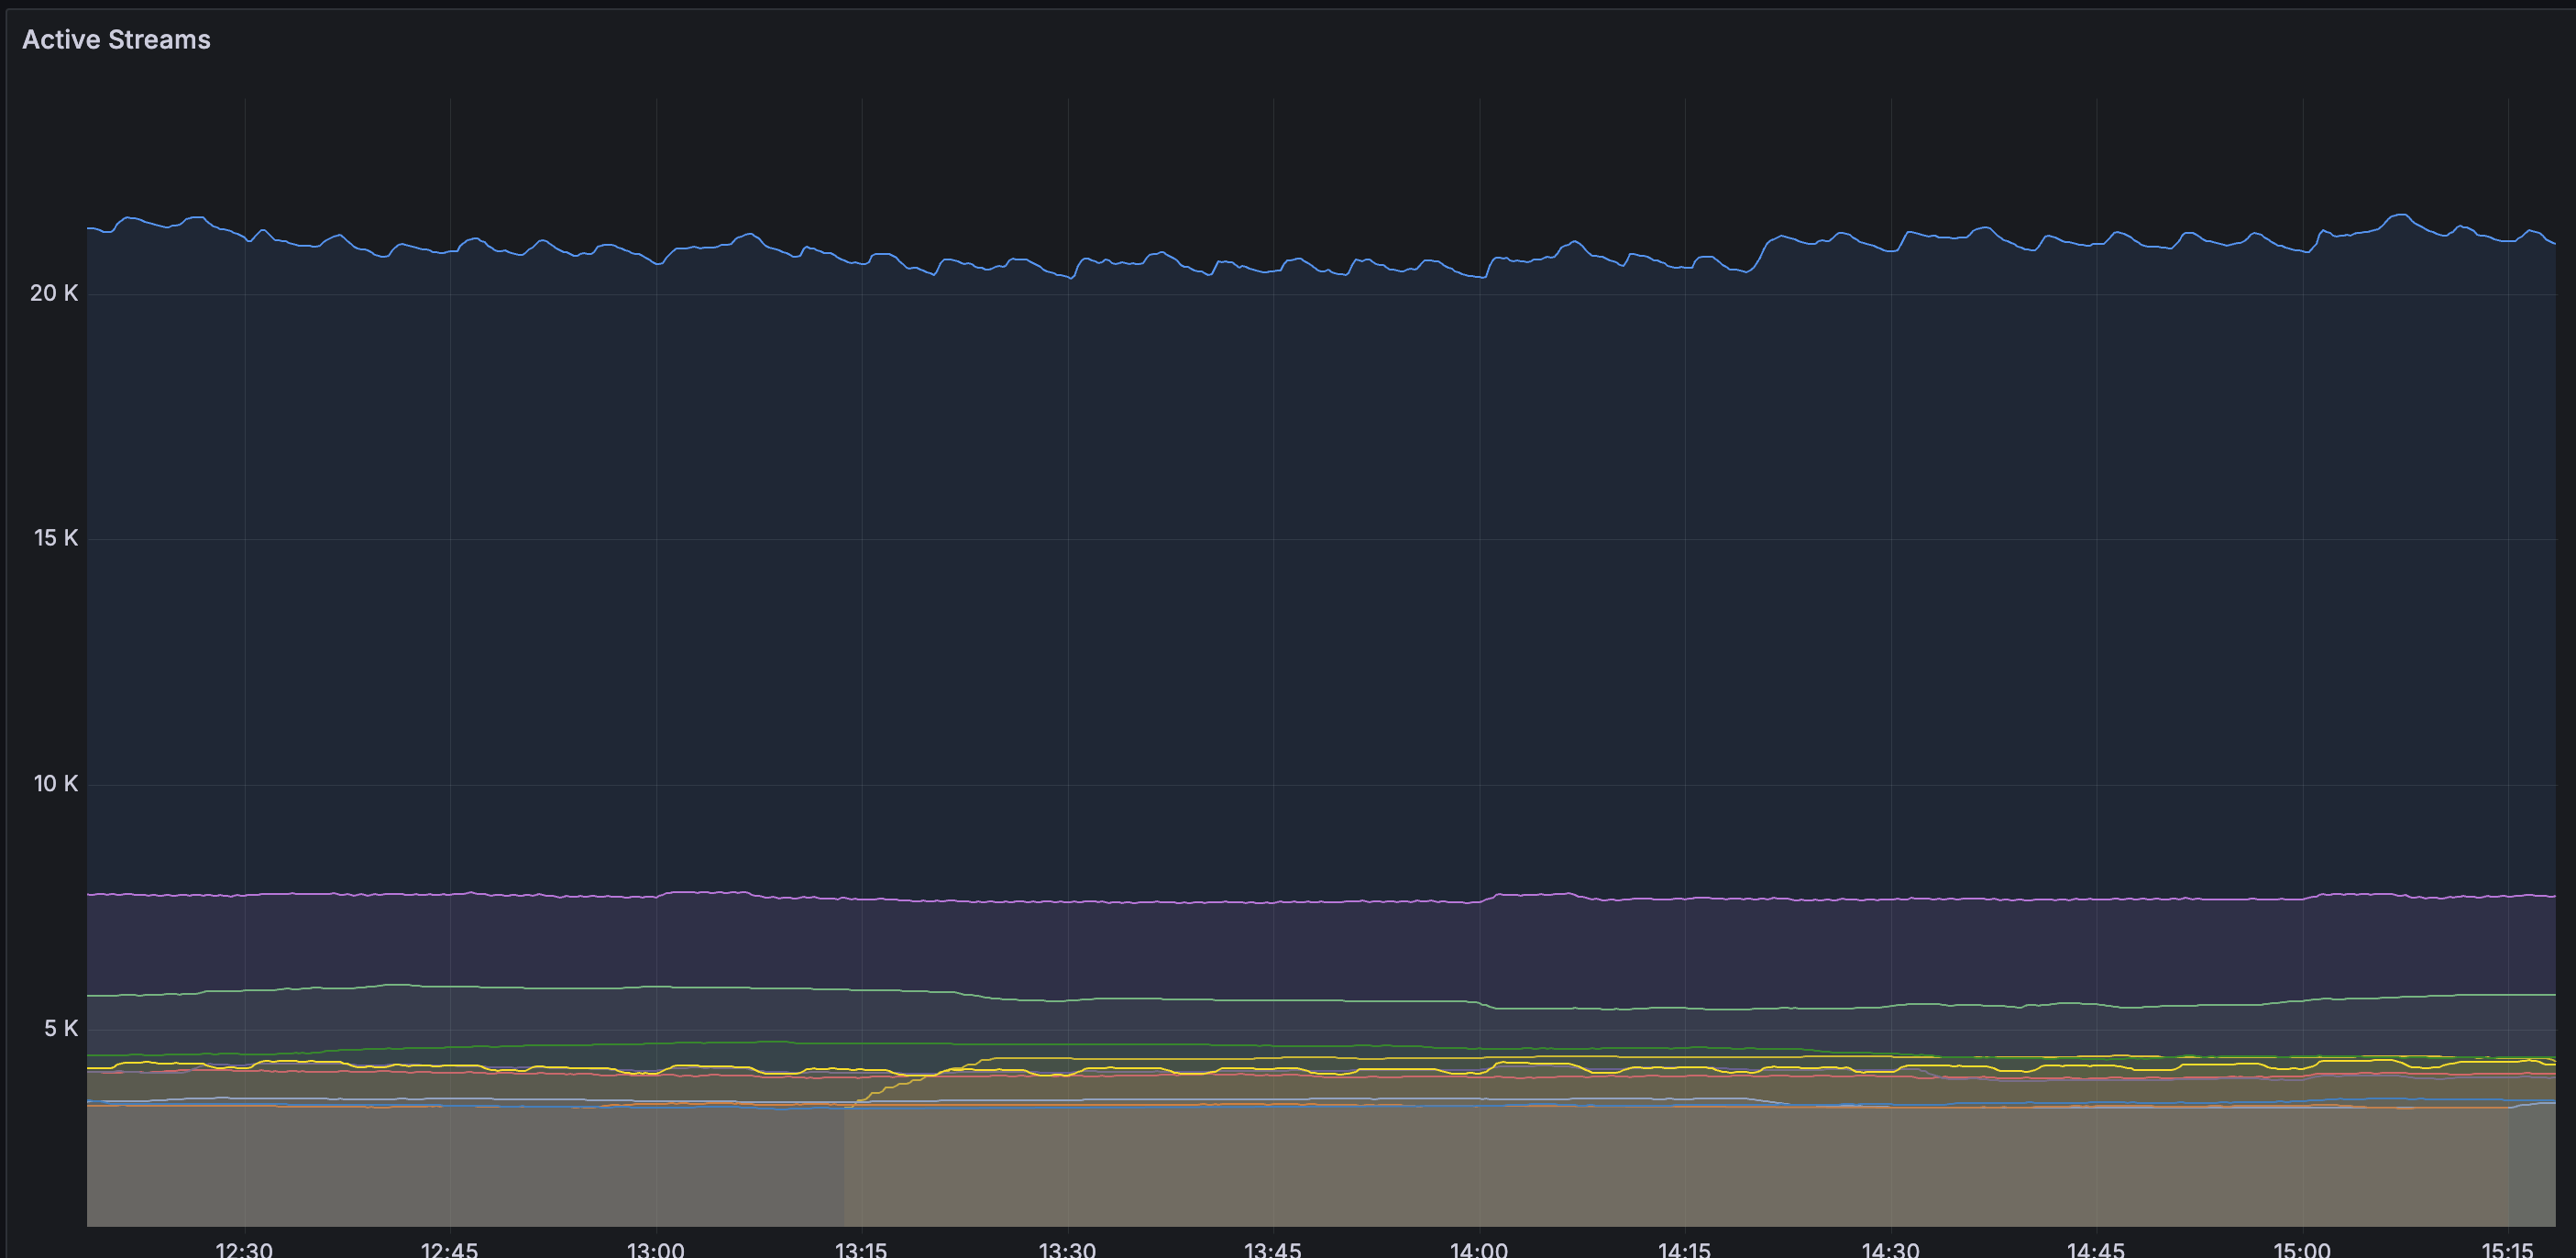 | 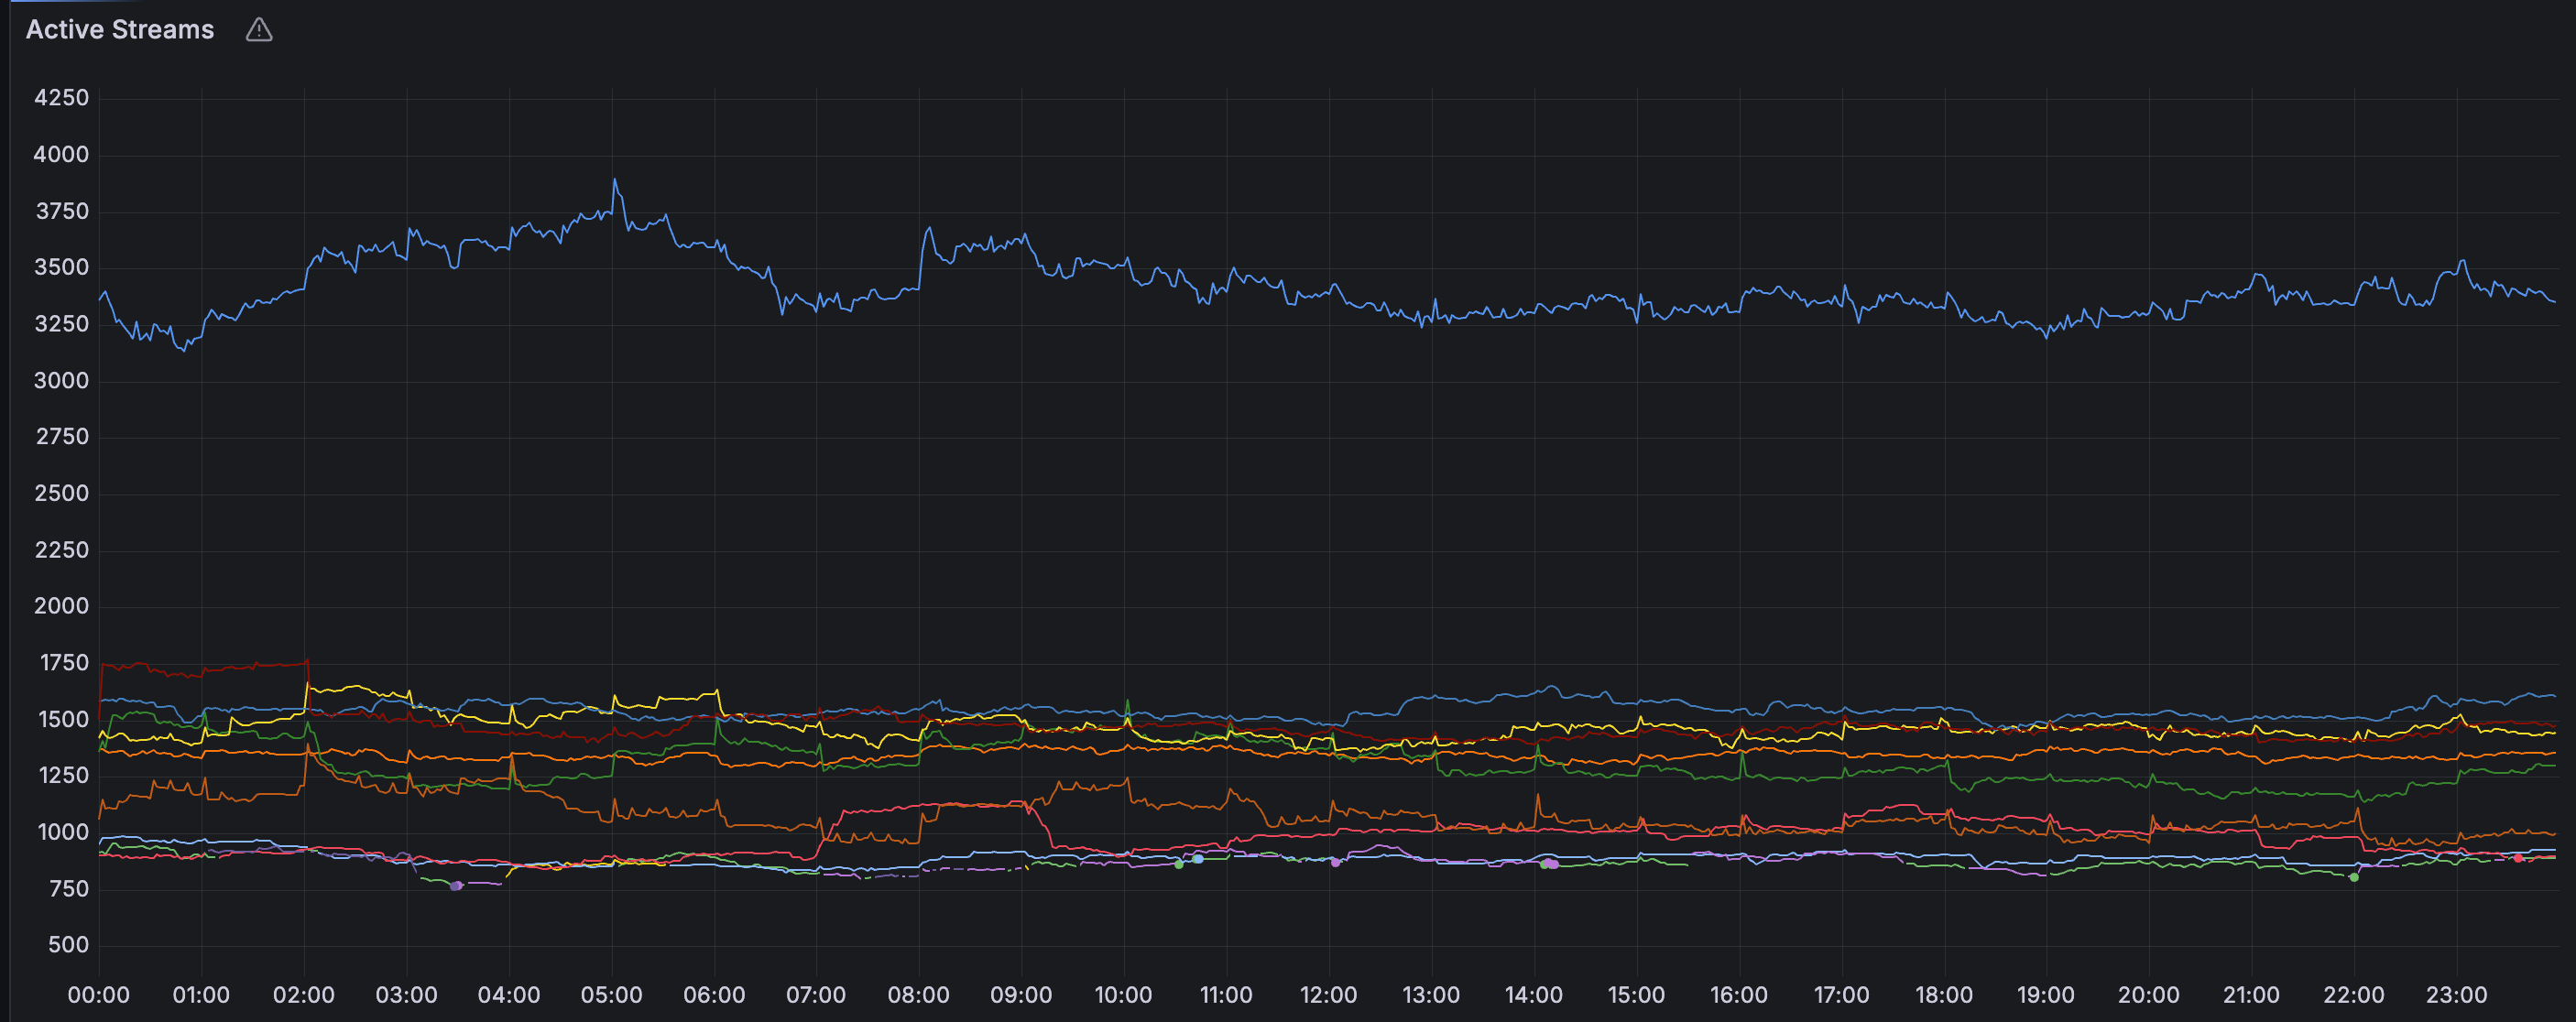 |
Chunk Flush Reason
The chart below shows that the full Chunk Flush Reason increased from 70% to over 90%. In theory, the total log volume remains unchanged, but the reduced number of streams means each stream needs to handle more logs, accelerating chunk writes and leading to more full Chunk Flush Reasons.
| Before | After |
|---|---|
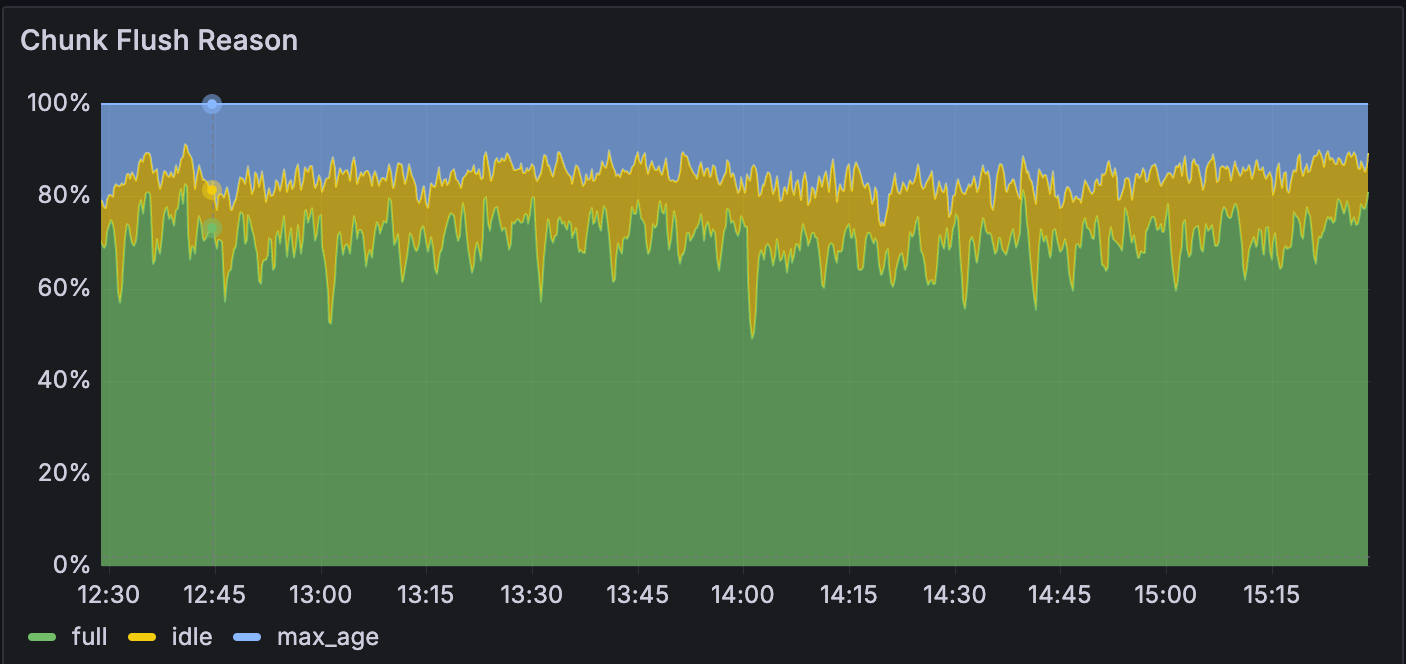 | 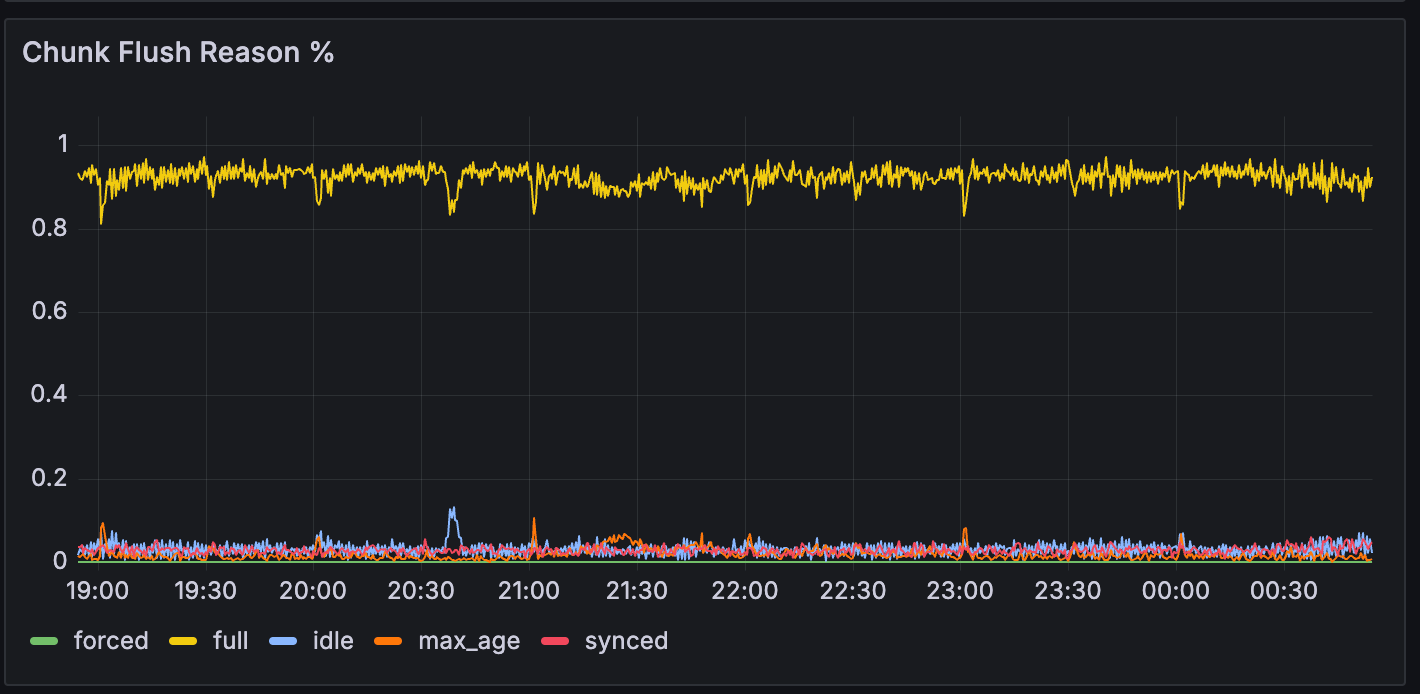 |
Results
In addition to the increased full Chunk Flush Reason and reduced stream numbers, improving Loki labels brought the following benefits.
Higher Ingester Write Performance
The table below shows the resource differences required for Ingester before and after improving Loki labels. The number of Ingester replicas decreased to about 30% of the original, and memory usage decreased to less than 25%. Since we set pod anti-affinity for Ingesters, the number of worker nodes matches the number of Ingesters, saving an estimated 70,000 yen per month.
| Ingester's #replicas | CPU core | memory usage in GB | dedicated worker node | |
|---|---|---|---|---|
| Before | 30 | 10 | 90 | 30 |
| After | 12 | 7.5 | 21 | 12 |
Completely Eliminated Object Storage Rate Limit Occurrences
Another benefit of improving Loki labels is the elimination of frequent rate limit errors (429) in Object Storage. The following charts show the differences in 4xx HTTP status code errors before and after the improvement, indicating that no errors occurred in the buckets used by the new Loki. We believe this is due to the high full Chunk Flush Reason in the new Loki, combined with Compactor compressing remaining unfilled chunks, resulting in almost all chunks being data-intensive. Compared to using multiple sparse chunks, fewer dense chunks can store the same log volume, reducing the number of Object Storage API requests during log queries and eliminating rate limits. Additionally, increasing the number of sharding buckets from 10 to 20 also helped.
| Before | After |
|---|---|
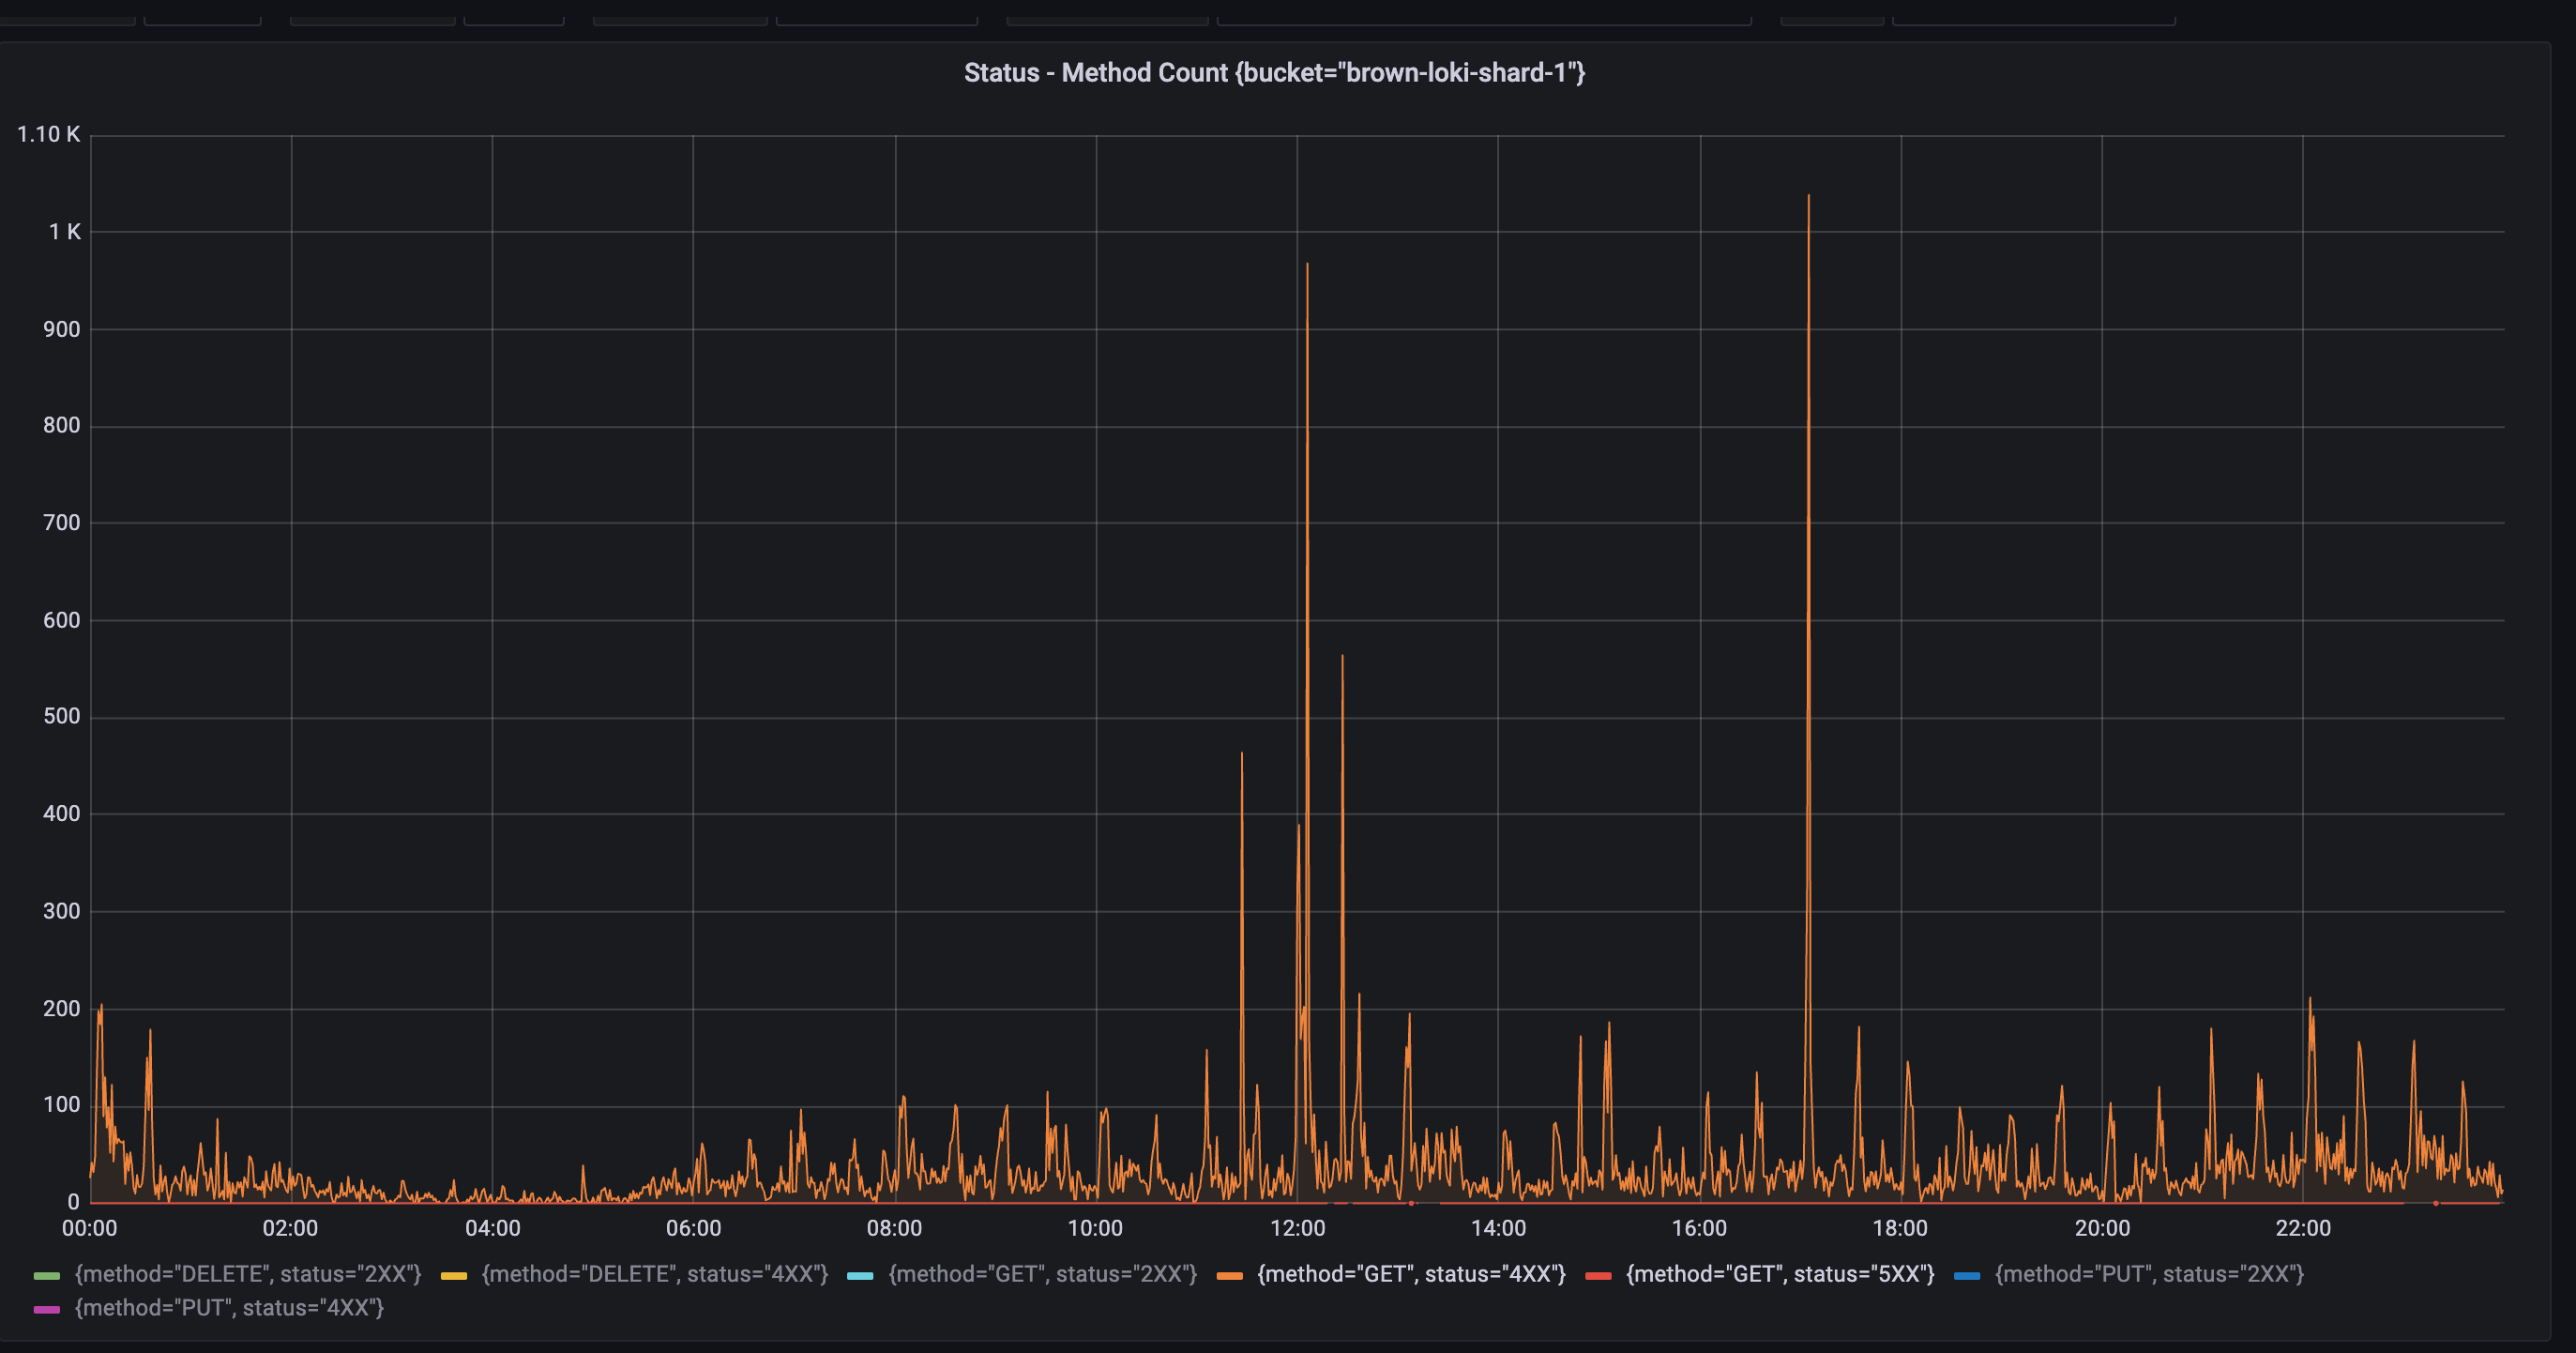 | 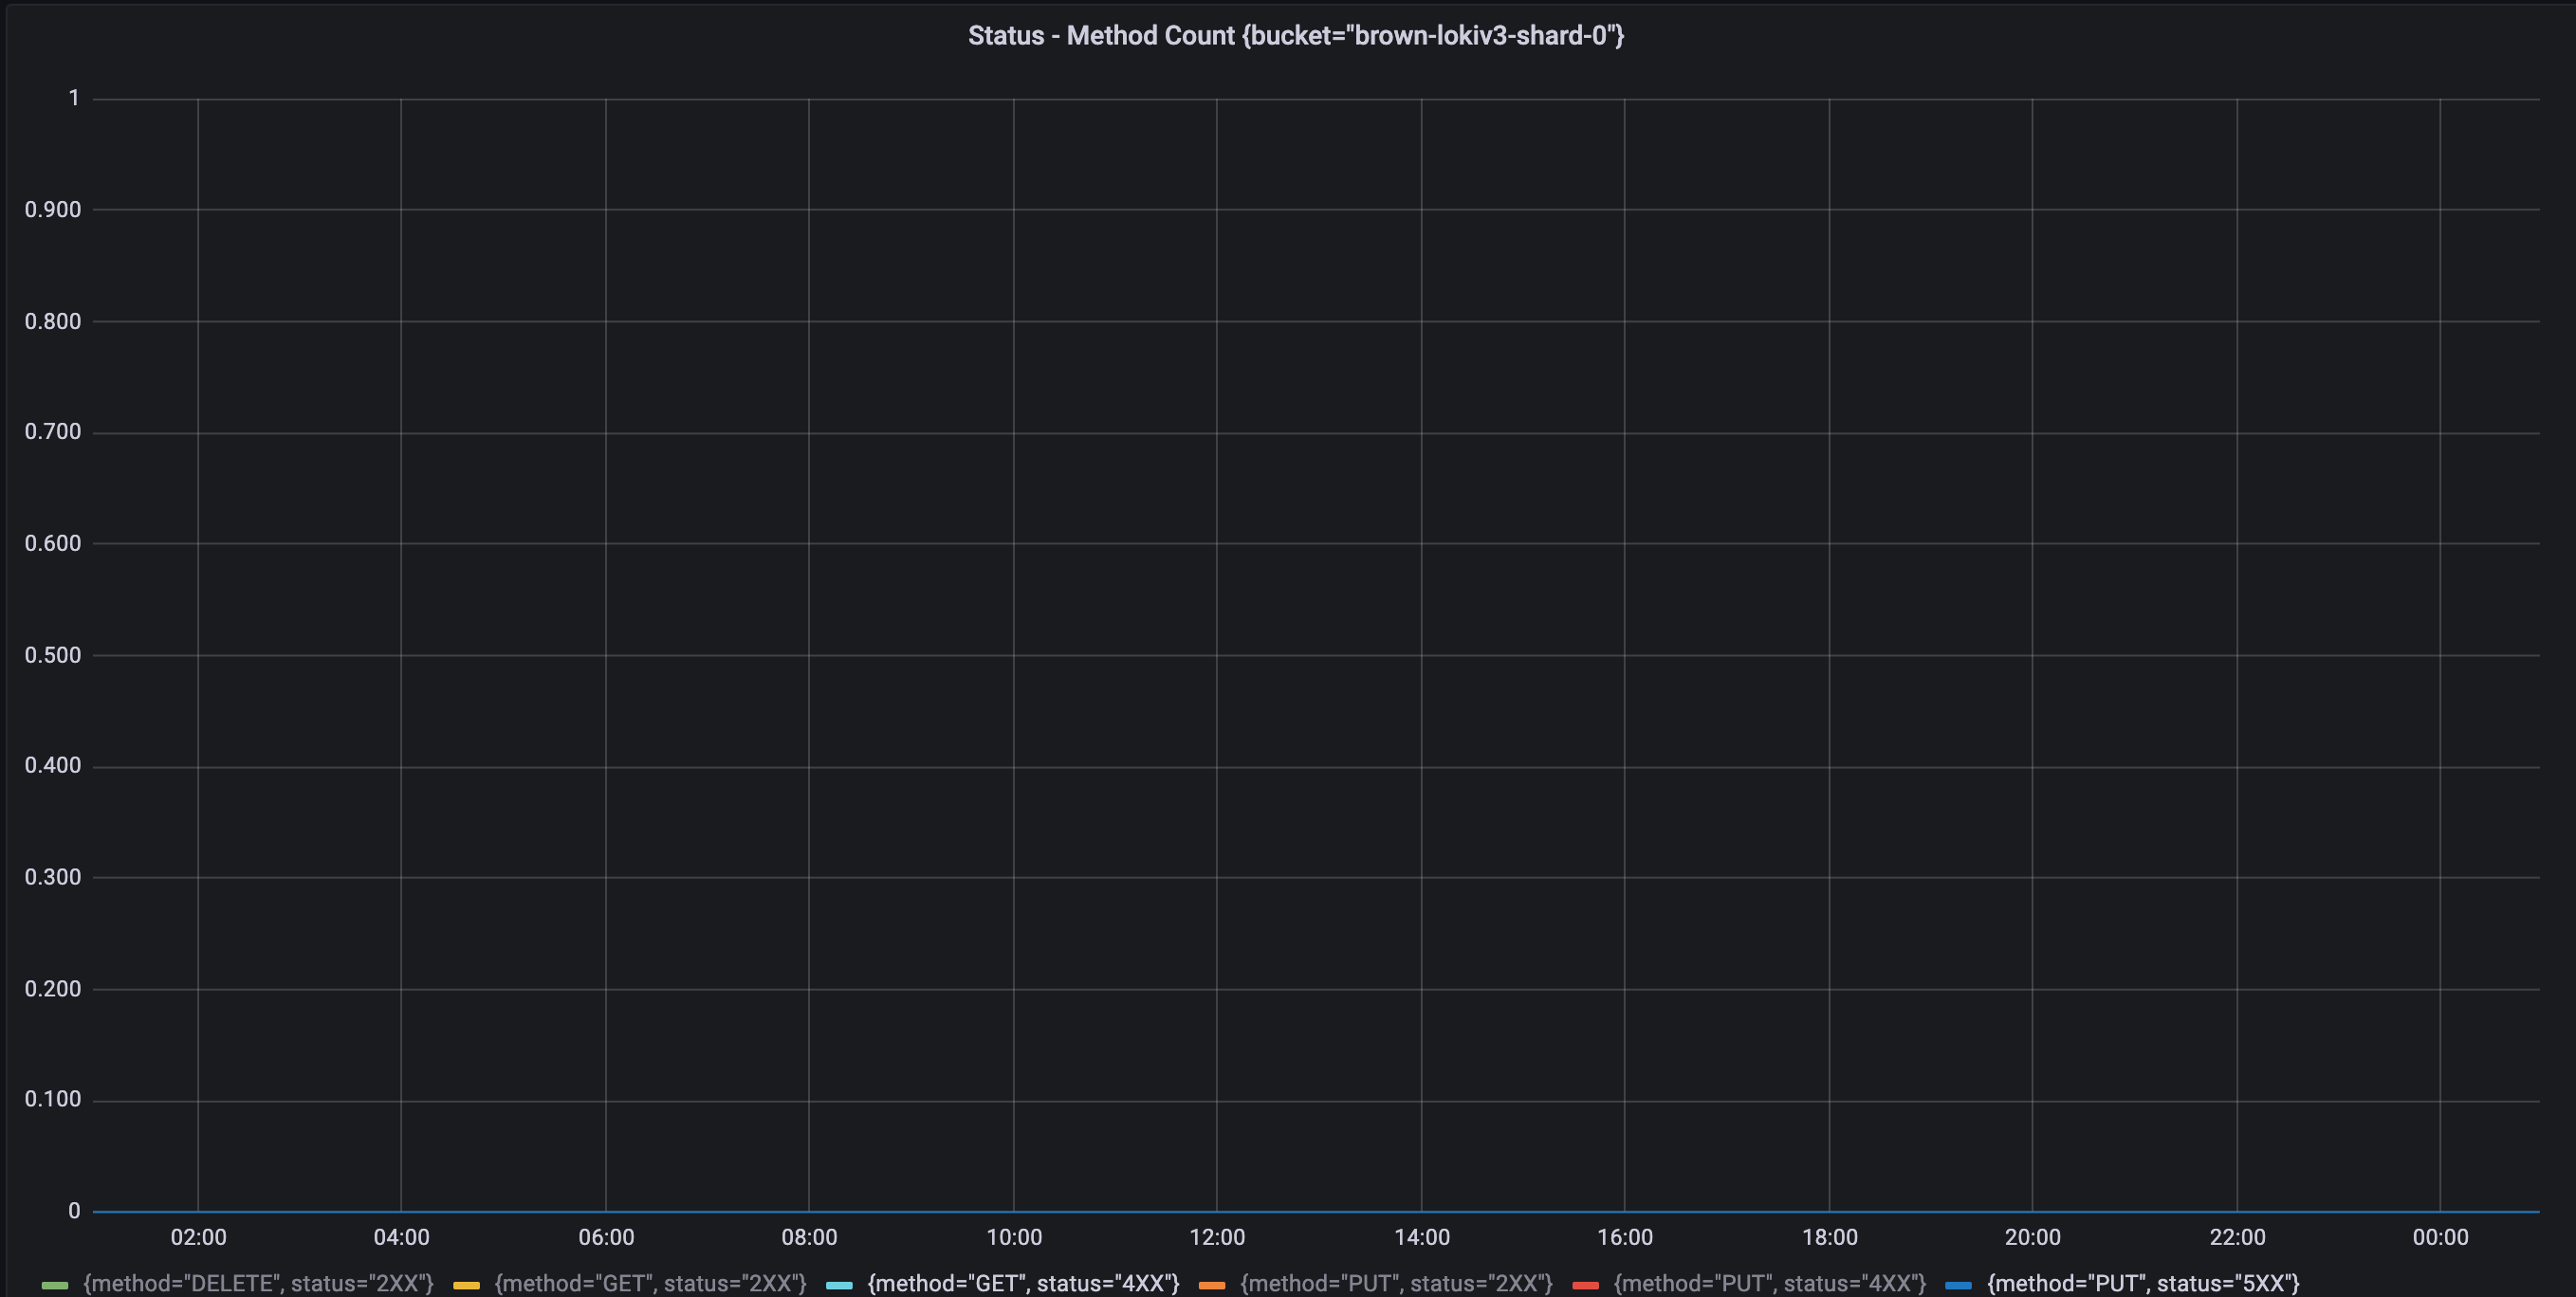 |
Conclusion
In this article, we introduced how we smoothly migrated the Loki cluster, especially by replacing Promtail with Vector and extensively using Vector's powerful Vector Remap Language and rich Vector Components. This helped us migrate without affecting existing users and allowed the new Loki to receive logs from the production environment using sampling techniques.
With actual log traffic, we could focus on tuning the new Loki configuration. Following official recommendations, we made special adjustments to Loki labels, significantly reducing the resources needed for log writes and eliminating potential Object Storage burdens during log queries.
Additionally, Vector offers a Log to Metric Transform feature that can directly convert numerical values recorded in logs into Prometheus metrics. We used this feature to improve our previous Alloy experience, replacing Loki Ruler and thereby reducing Loki's load. It's worth mentioning that I encountered some areas for improvement while using Vector and attempted to make some contributions to Vector, hoping that Vector can develop even better.
Finally, the improvements to Loki labels mentioned earlier may cause potential loads on Loki's Distributor and other components, requiring special tuning. More details on Loki configuration adjustments will be discussed in the next article. Stay tuned!